Fleet Operations Command Centre
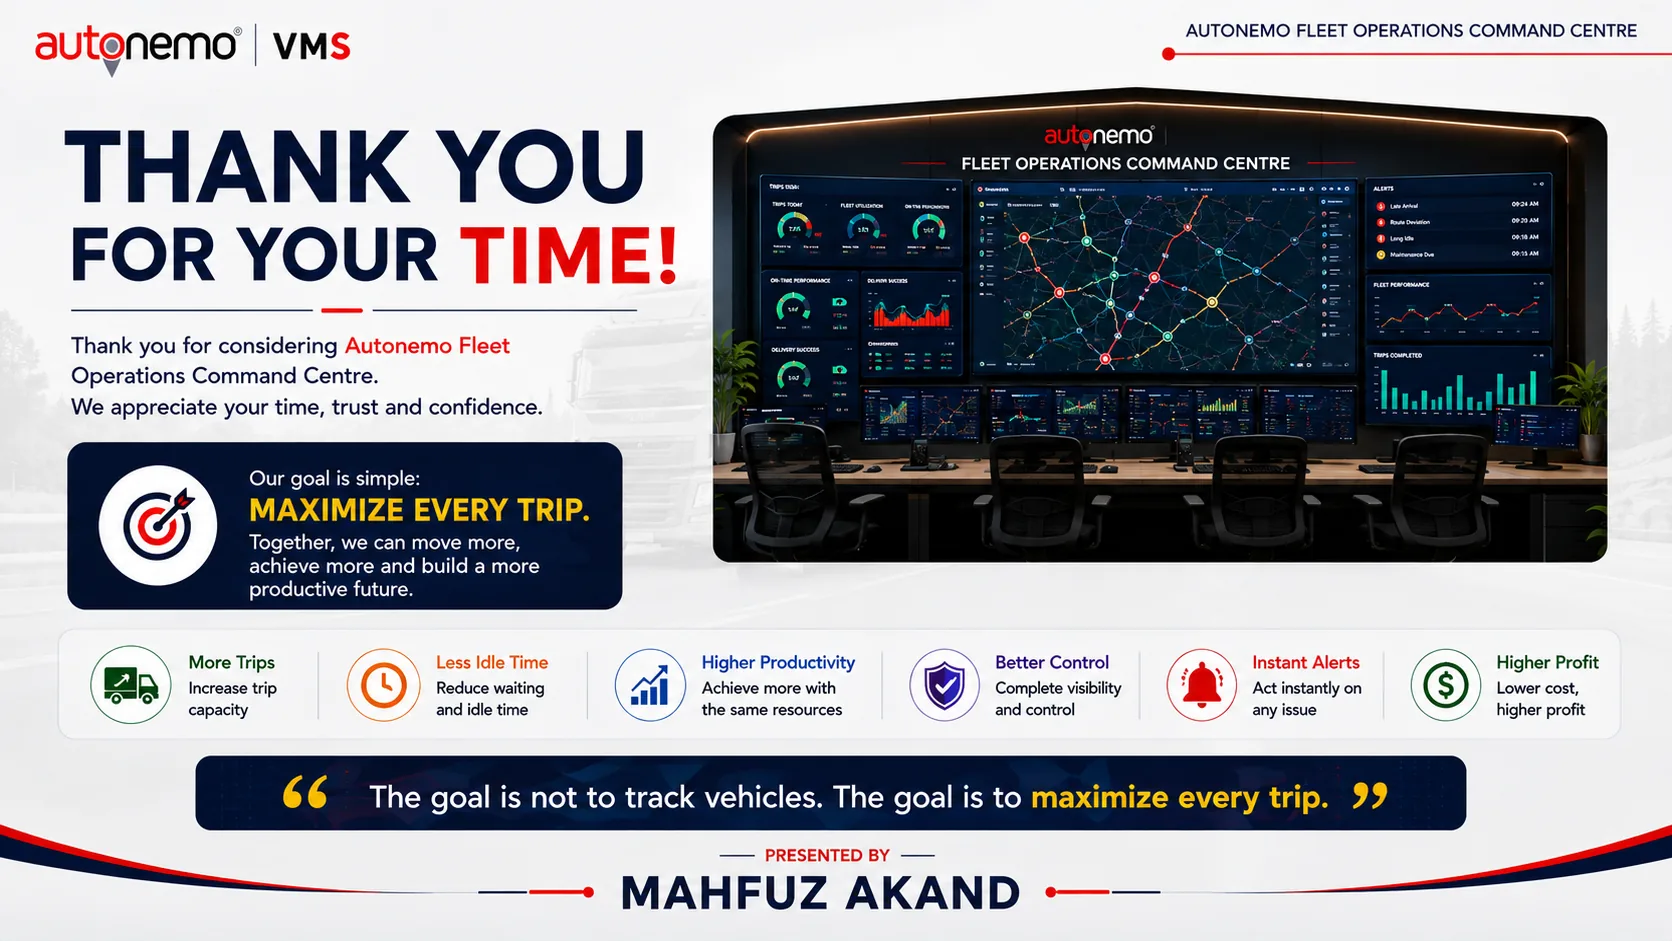
The goal is not to track vehicles. The goal is to maximize every trip.
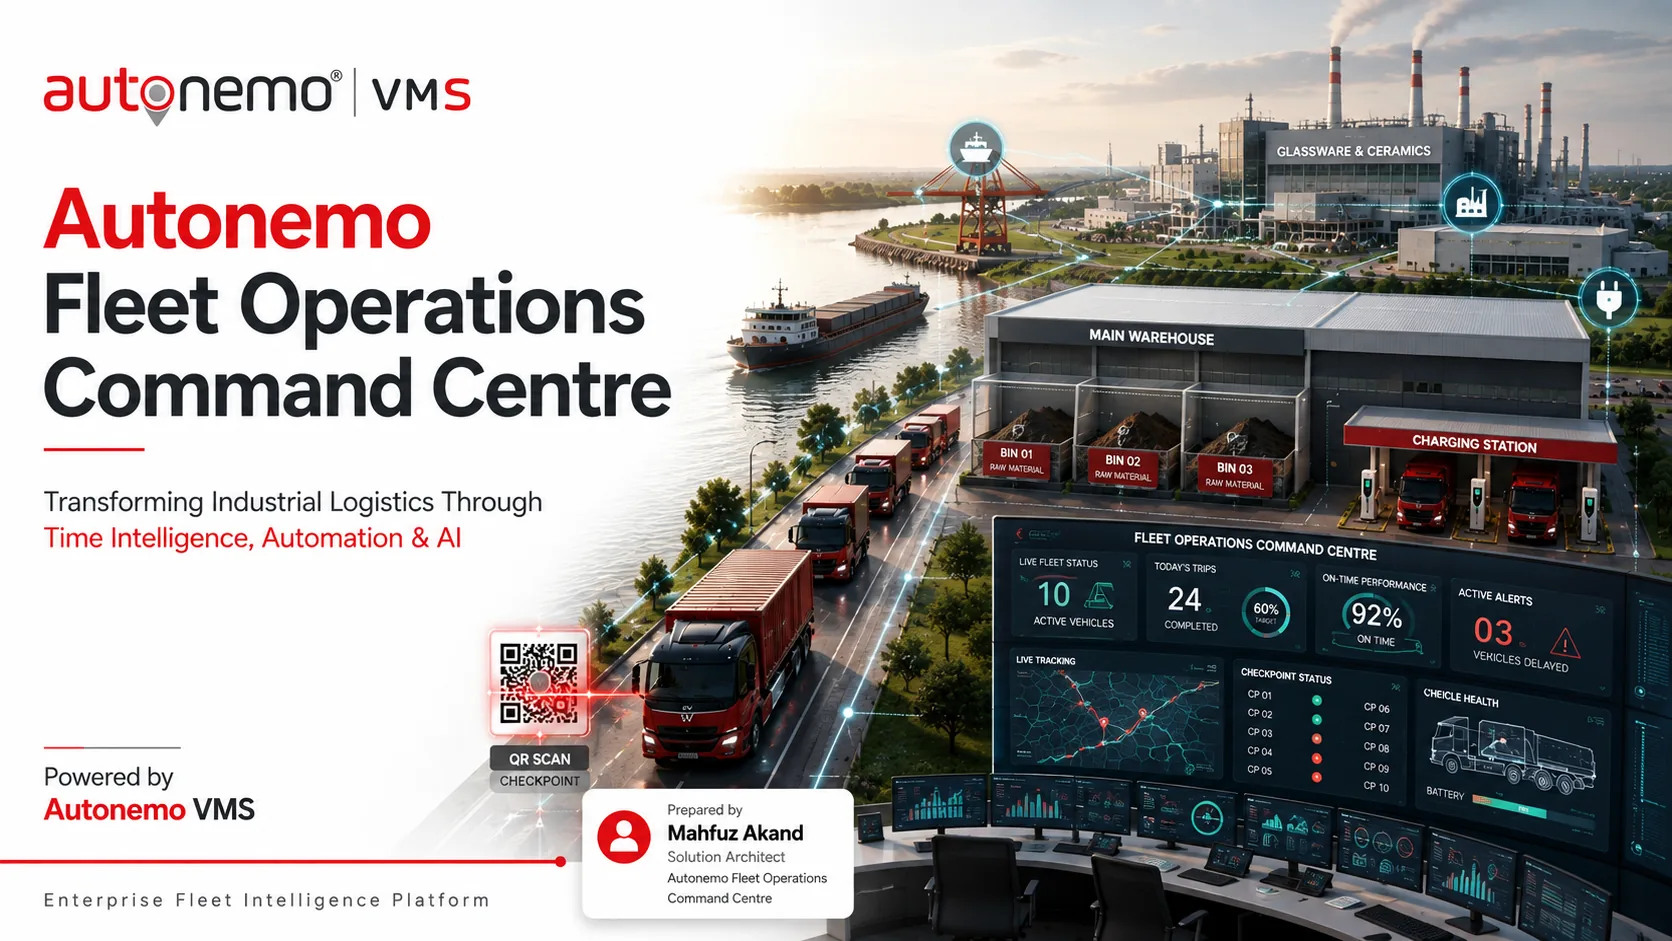
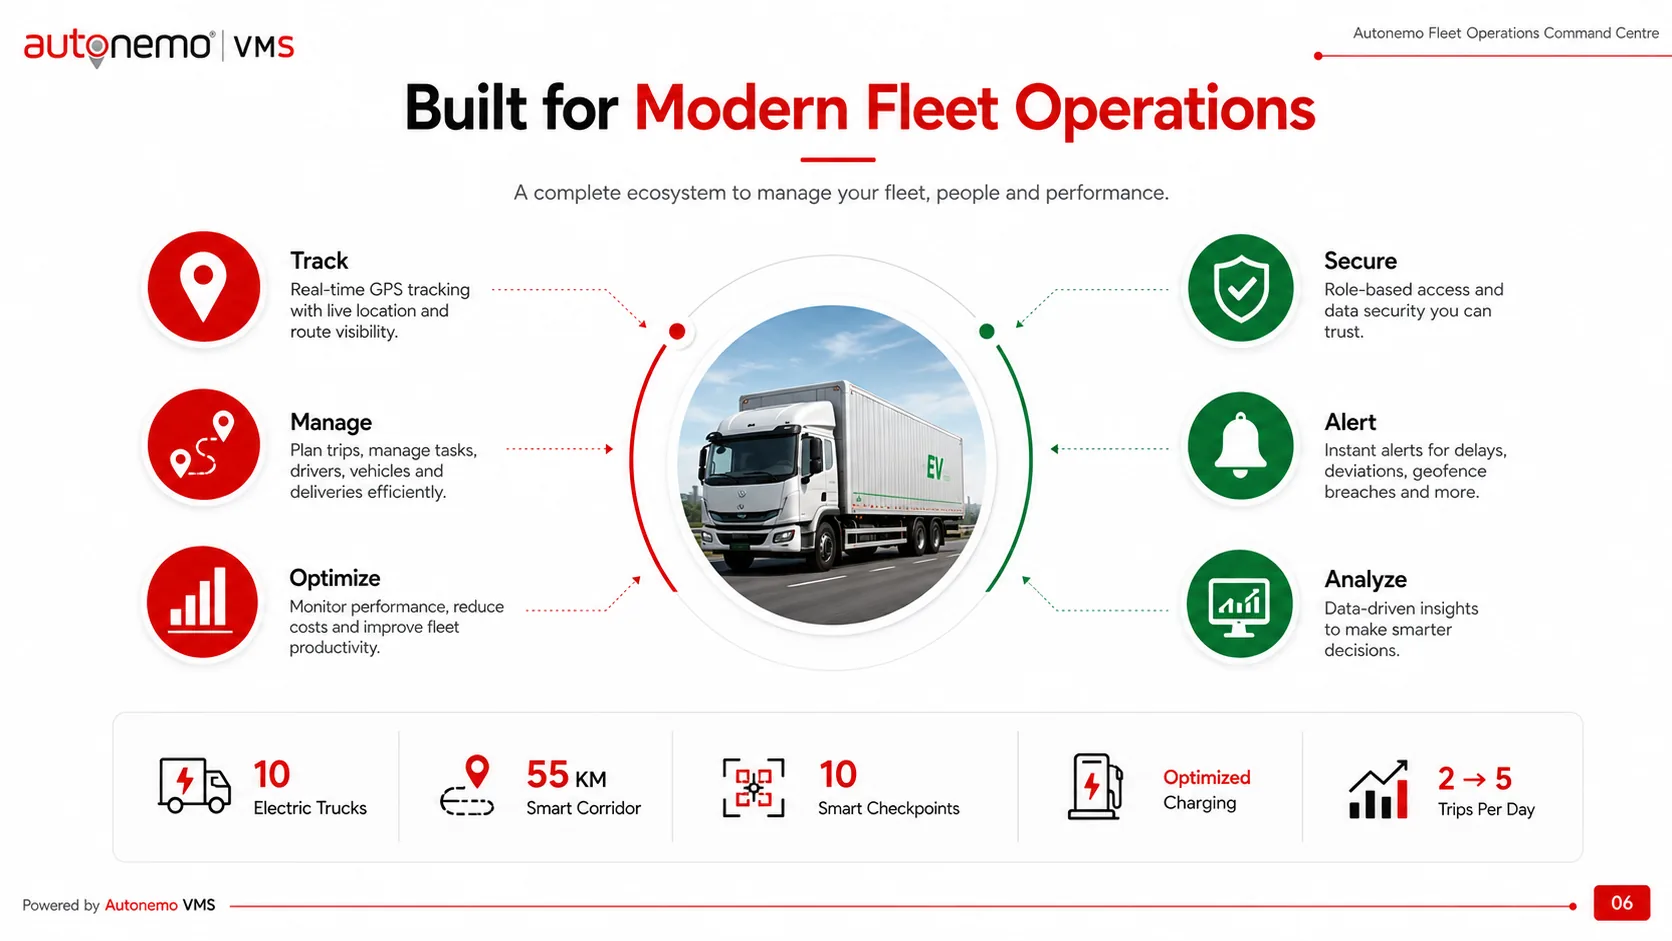
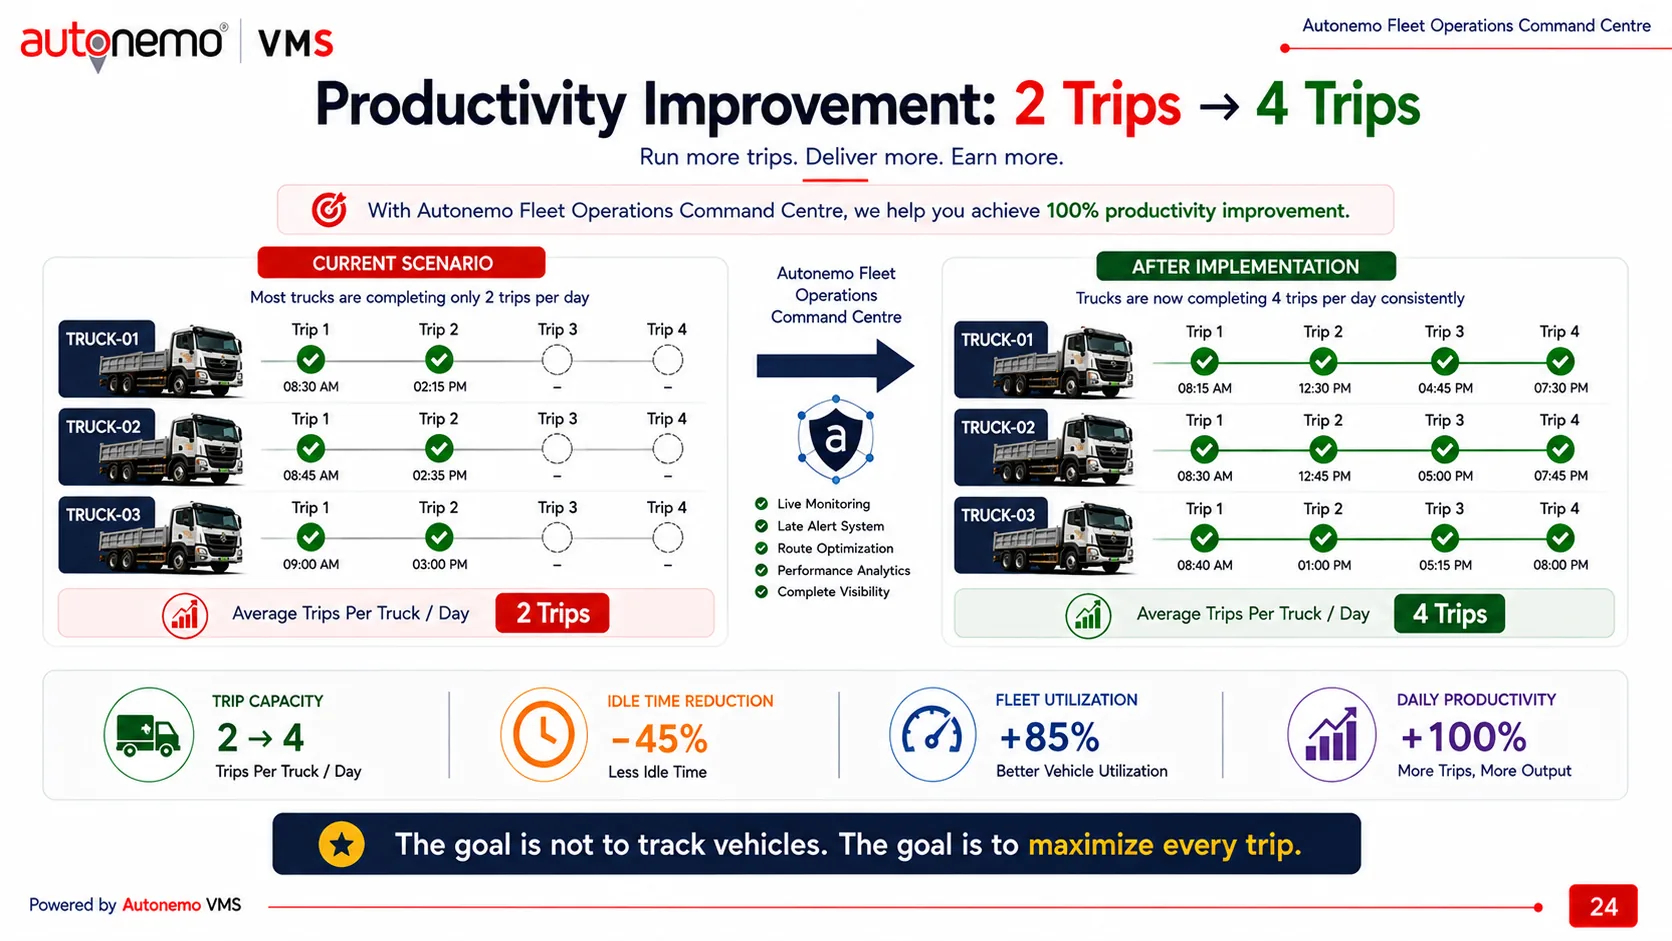
An industrial electric-truck fleet moving raw material along a 55 km corridor was completing two trips a day per truck — not because the distance was long, but because nobody could see where the hours went. This is the operations command centre built to answer that: every checkpoint QR-verified, every delay timed and explained, every truck, driver and charging session on one live timeline. The full 29-slide proposal is below — read it right here.
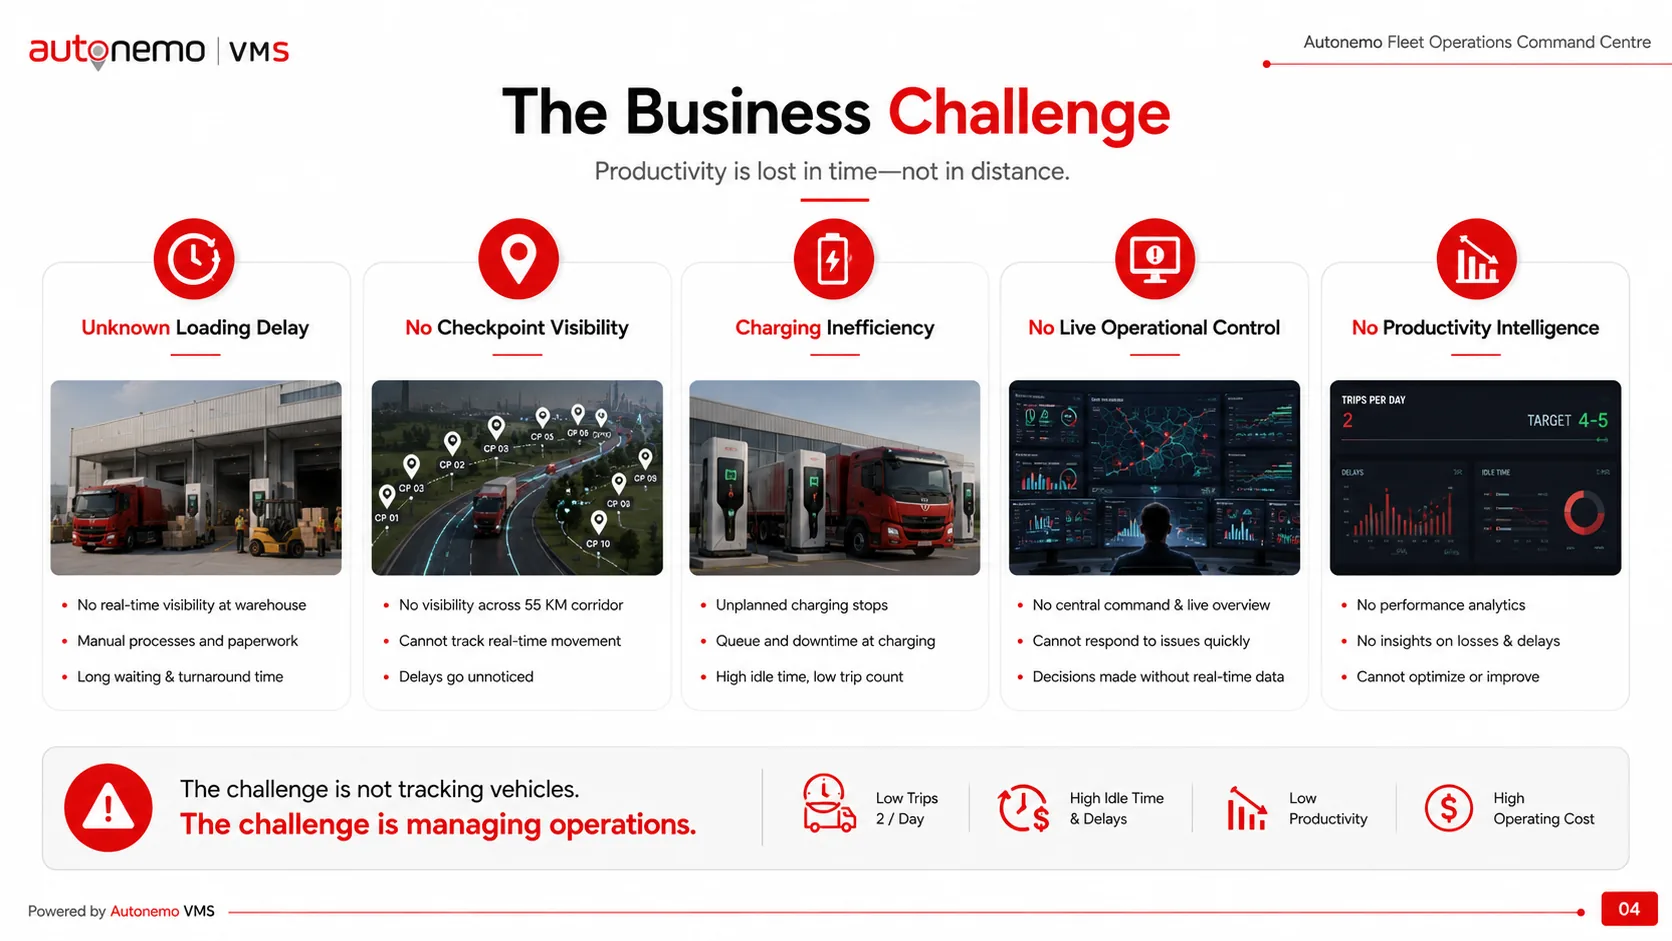
Productivity is lost in time — not in distance.
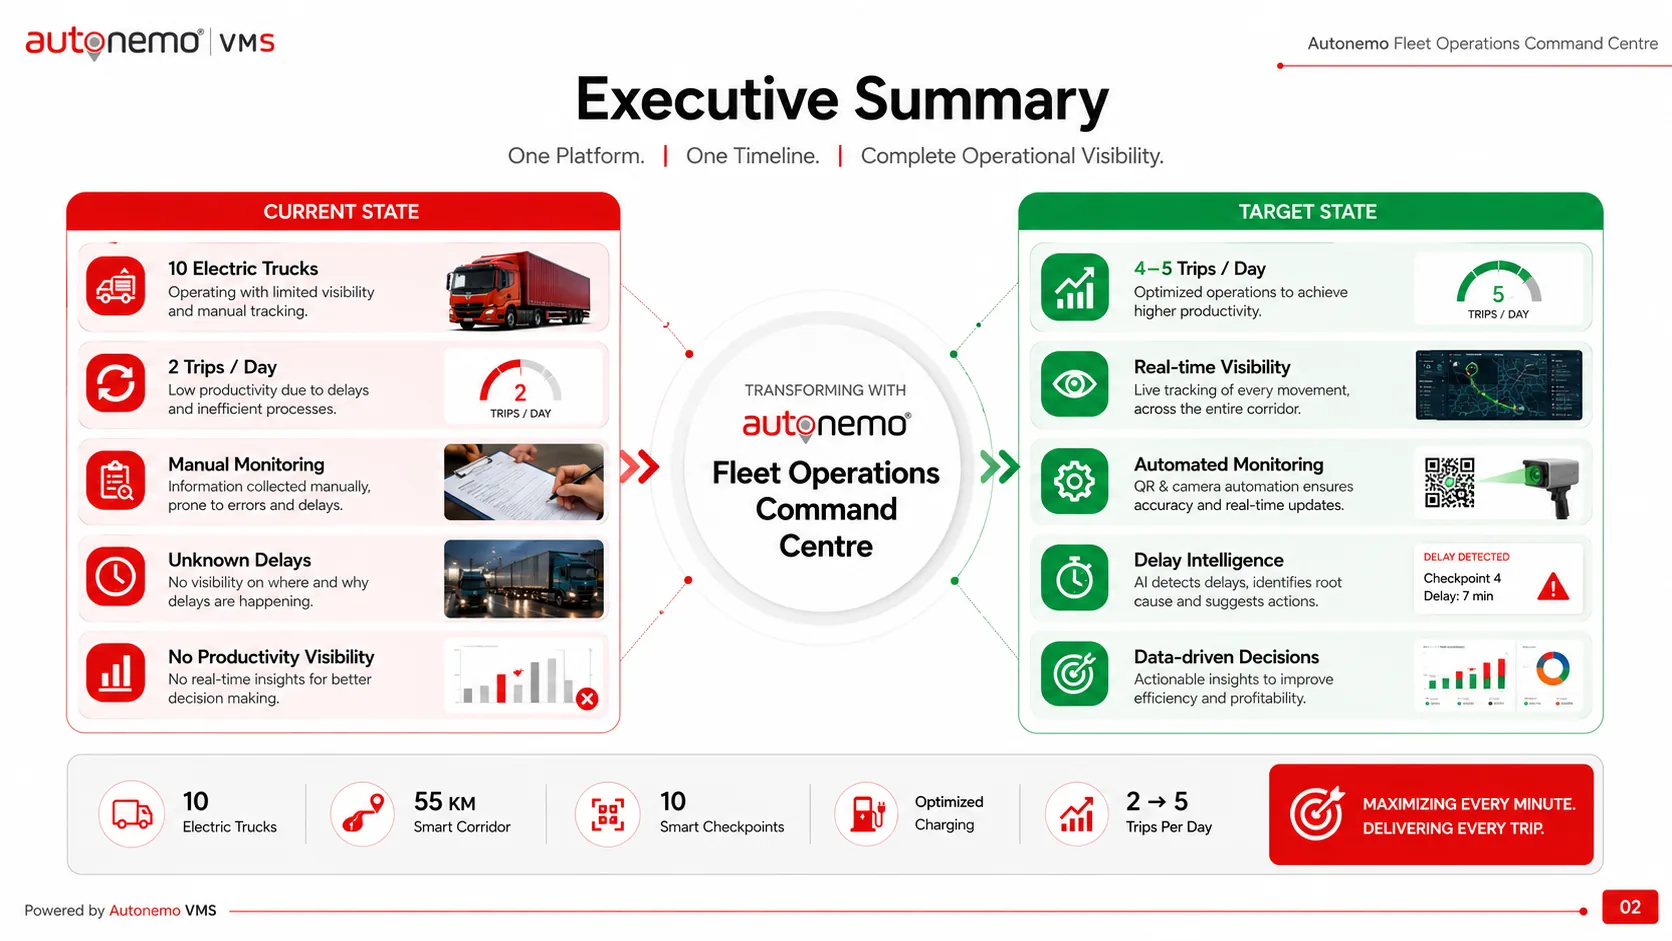
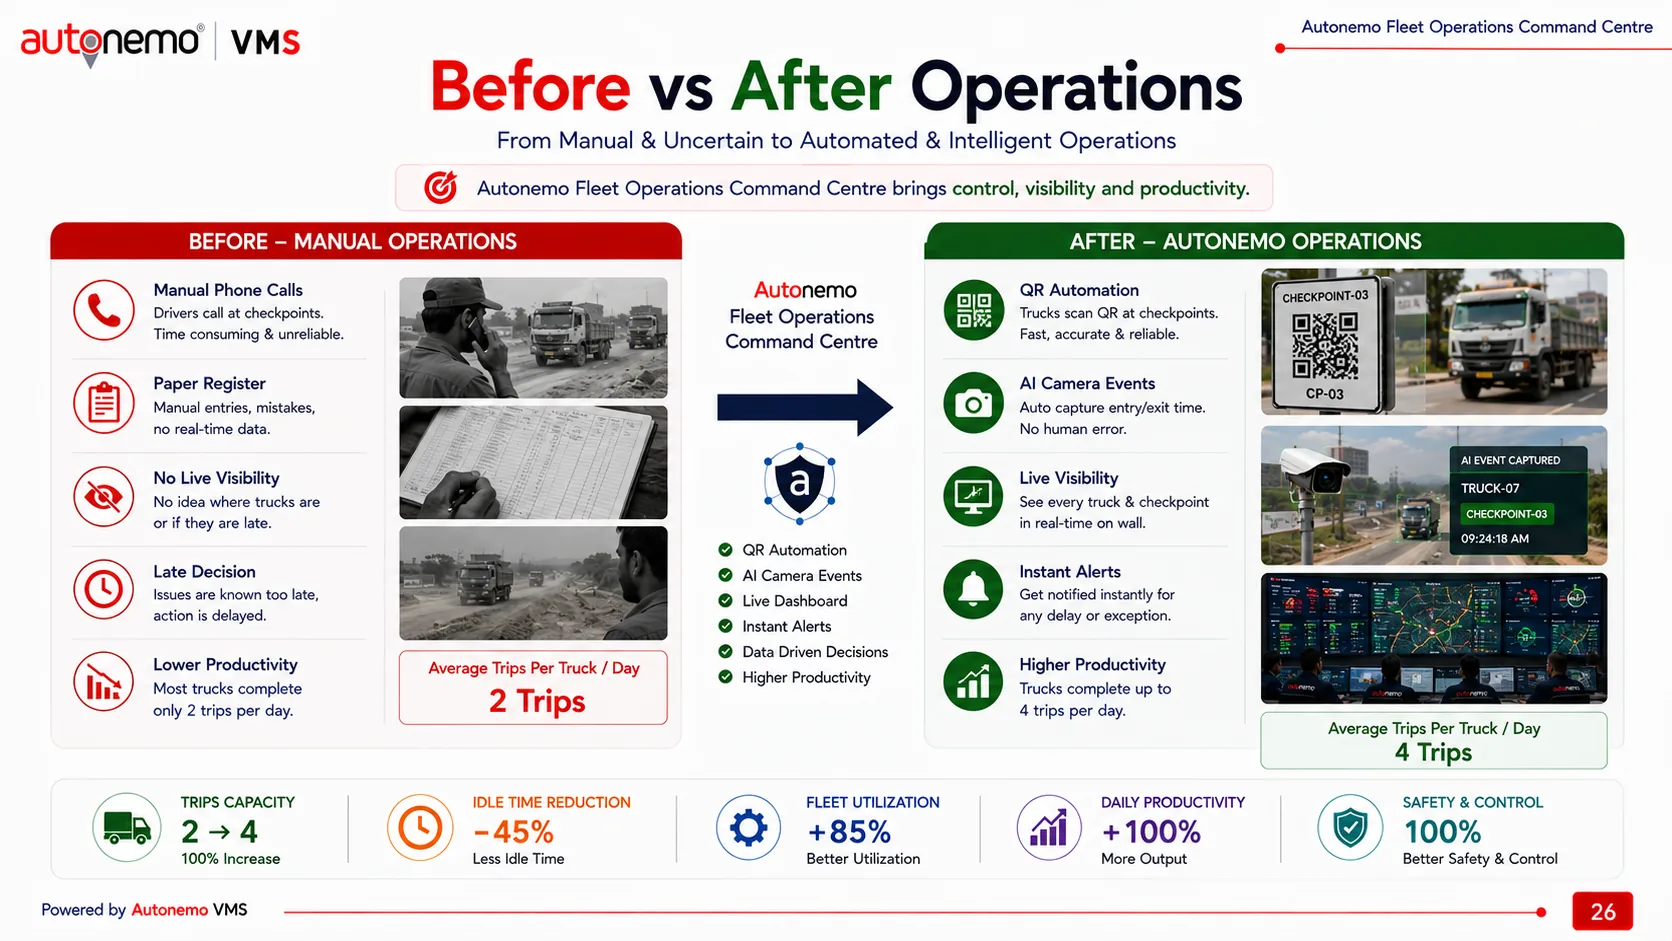
The fleet was not slow because the road was long. A truck spent ten to twelve hours a day idle — waiting to load, waiting at the gate, waiting to unload, waiting to charge — and none of that waiting was measured. Trip records were written by hand, delays were explained after the fact, and by the time a problem reached a manager the day was already gone.
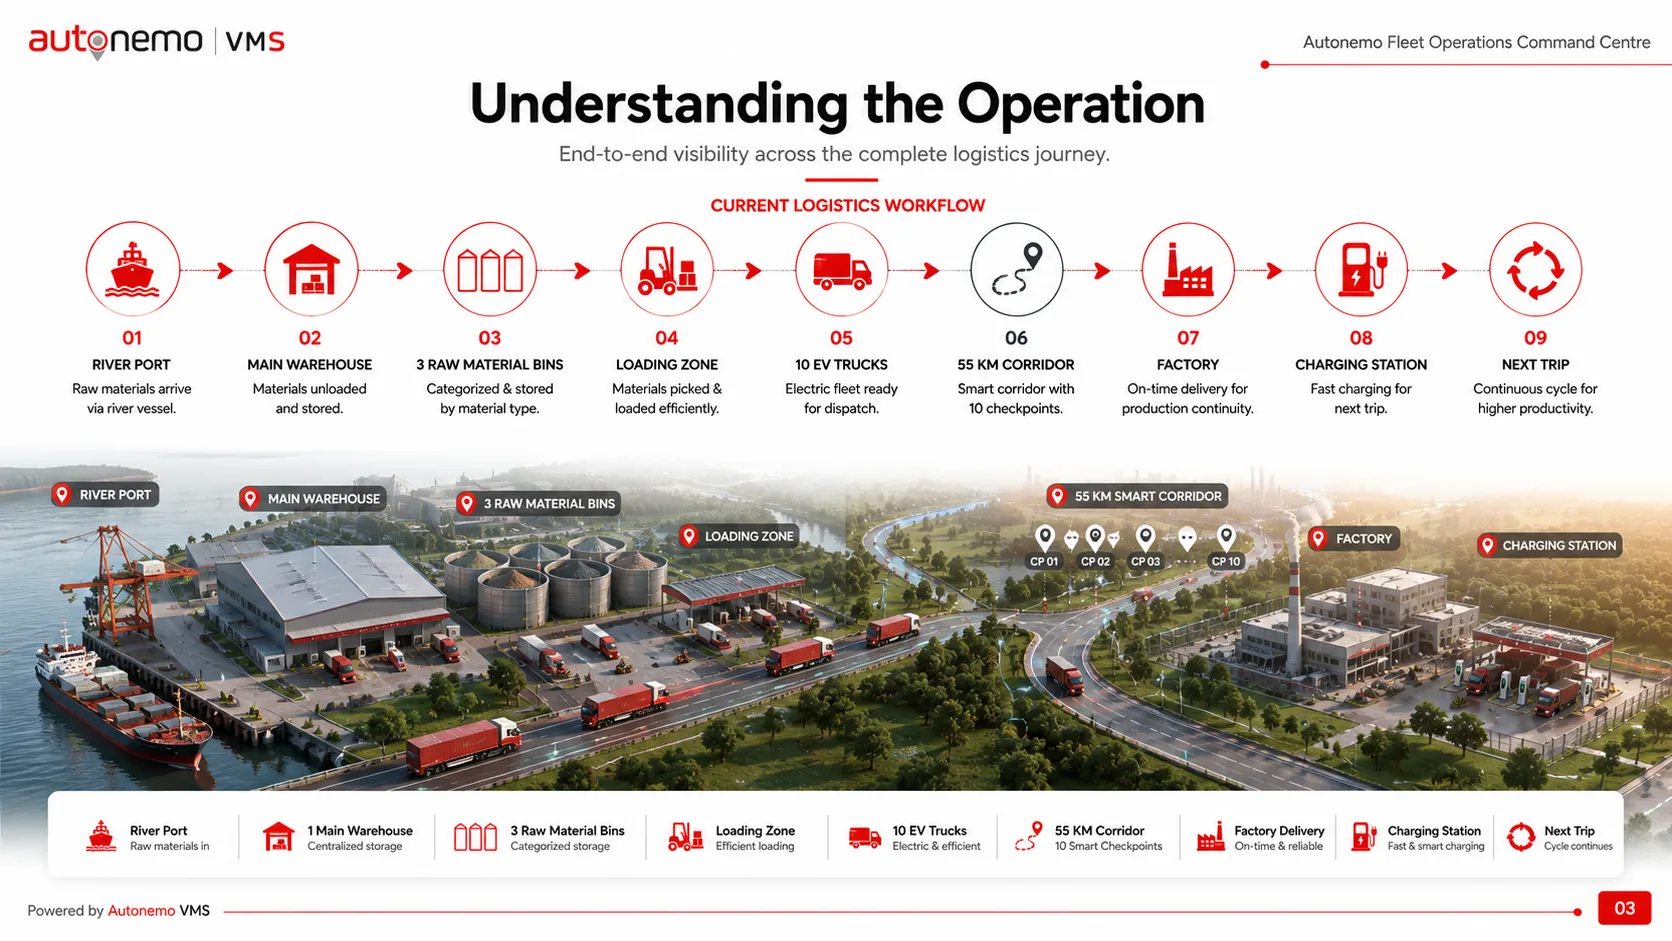
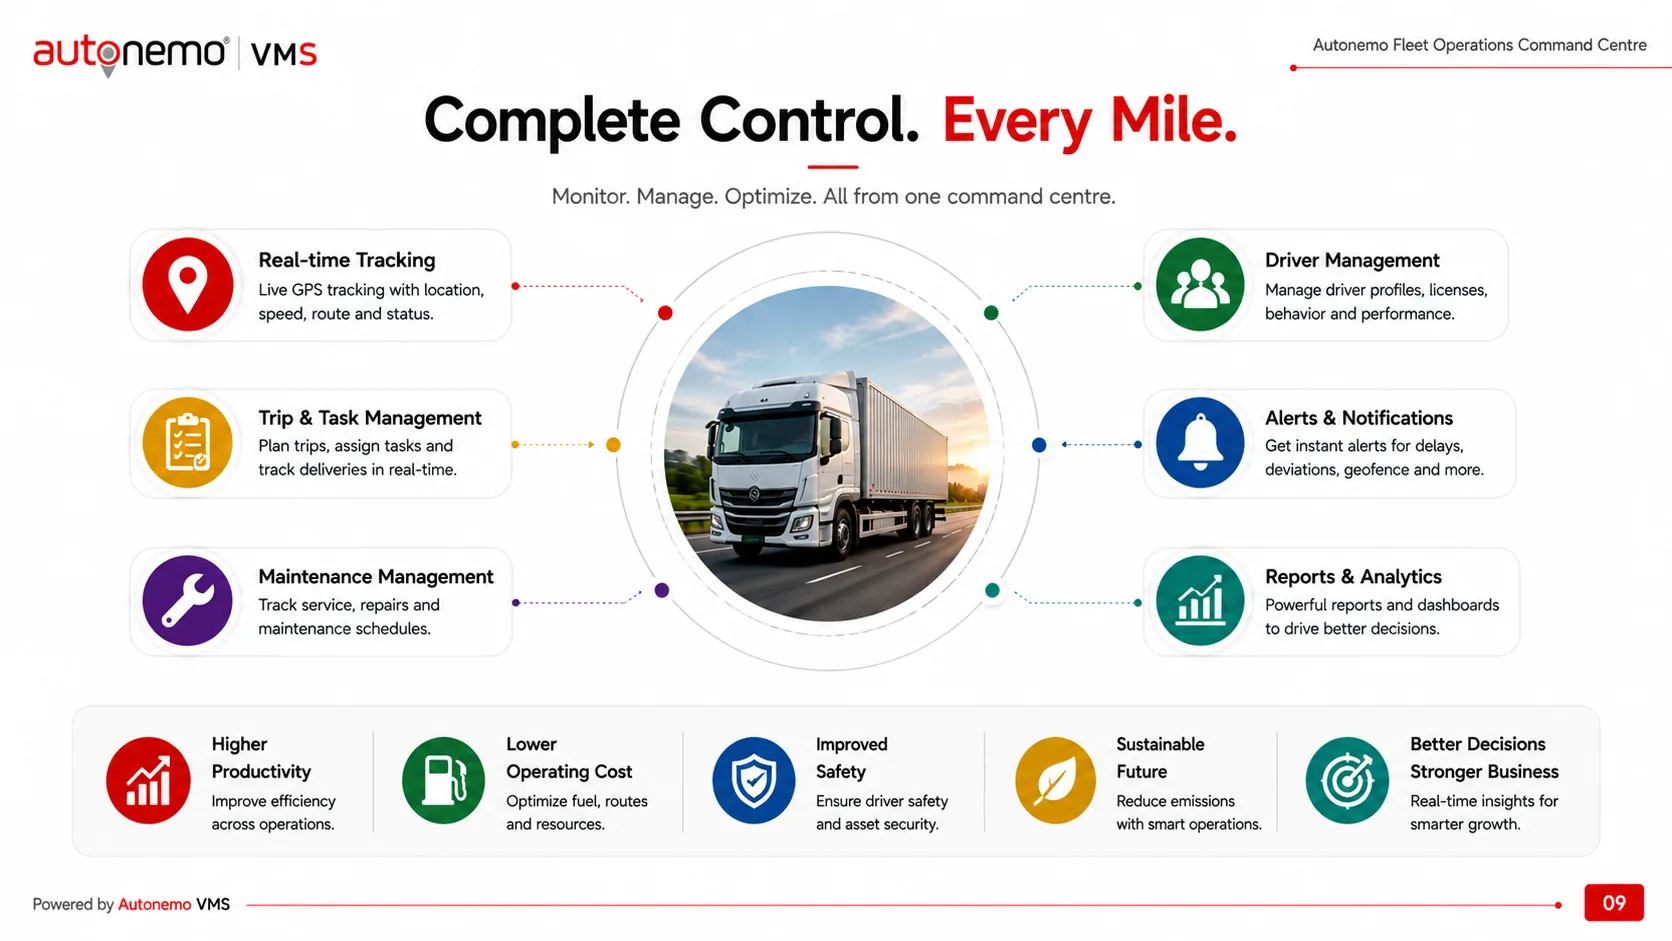
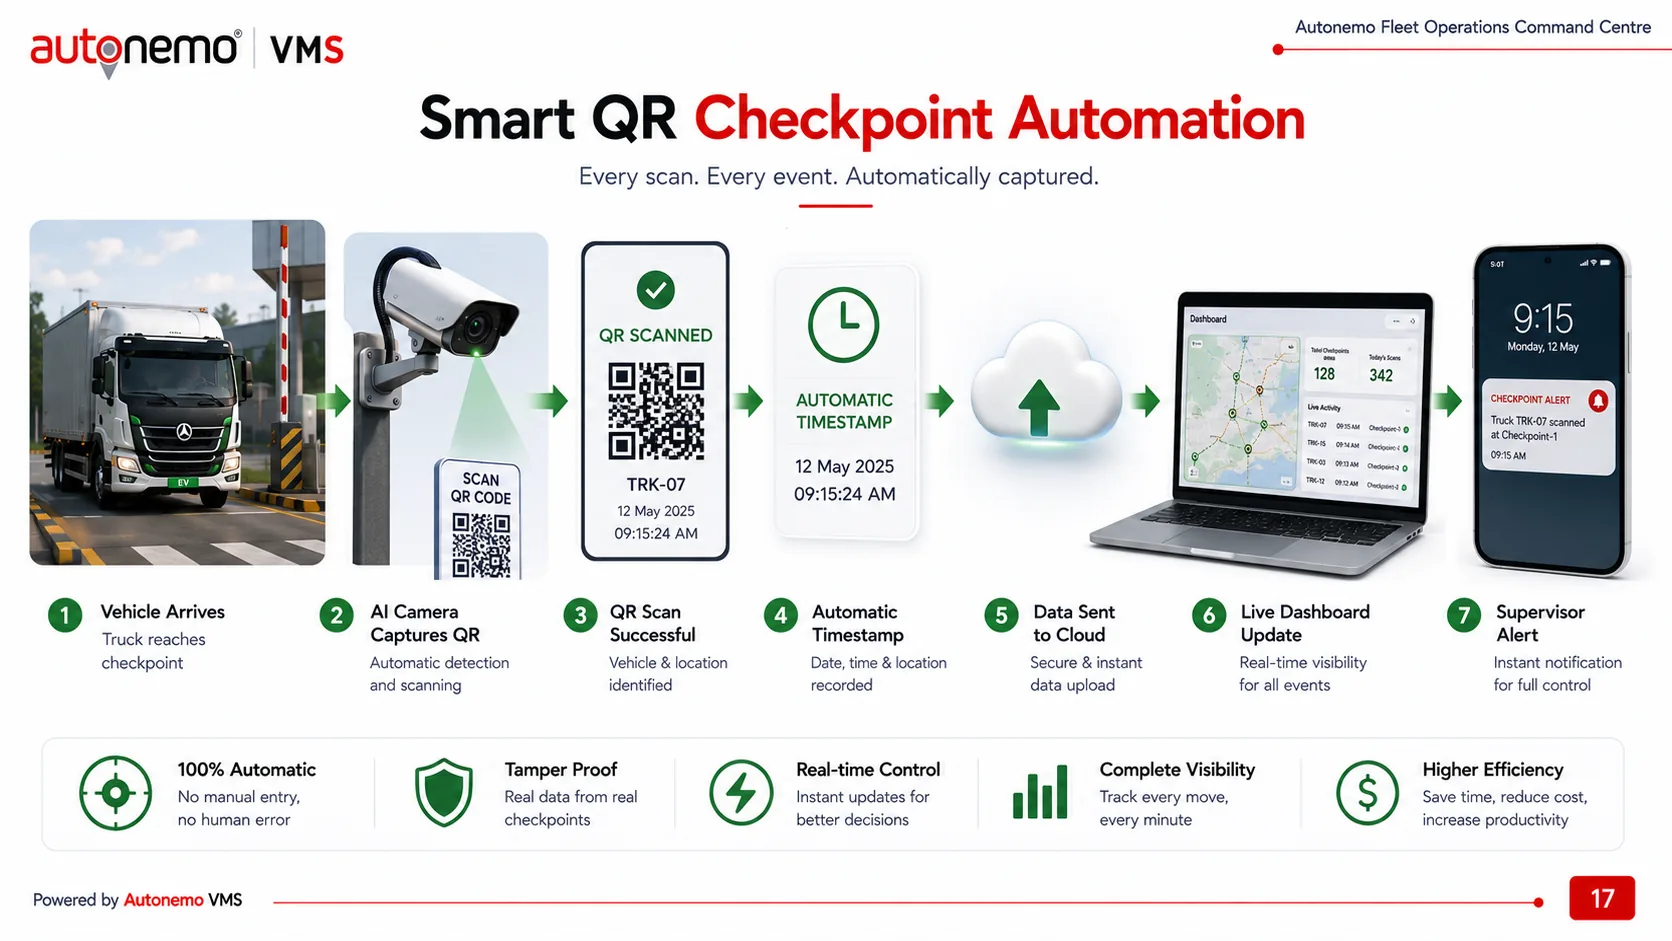
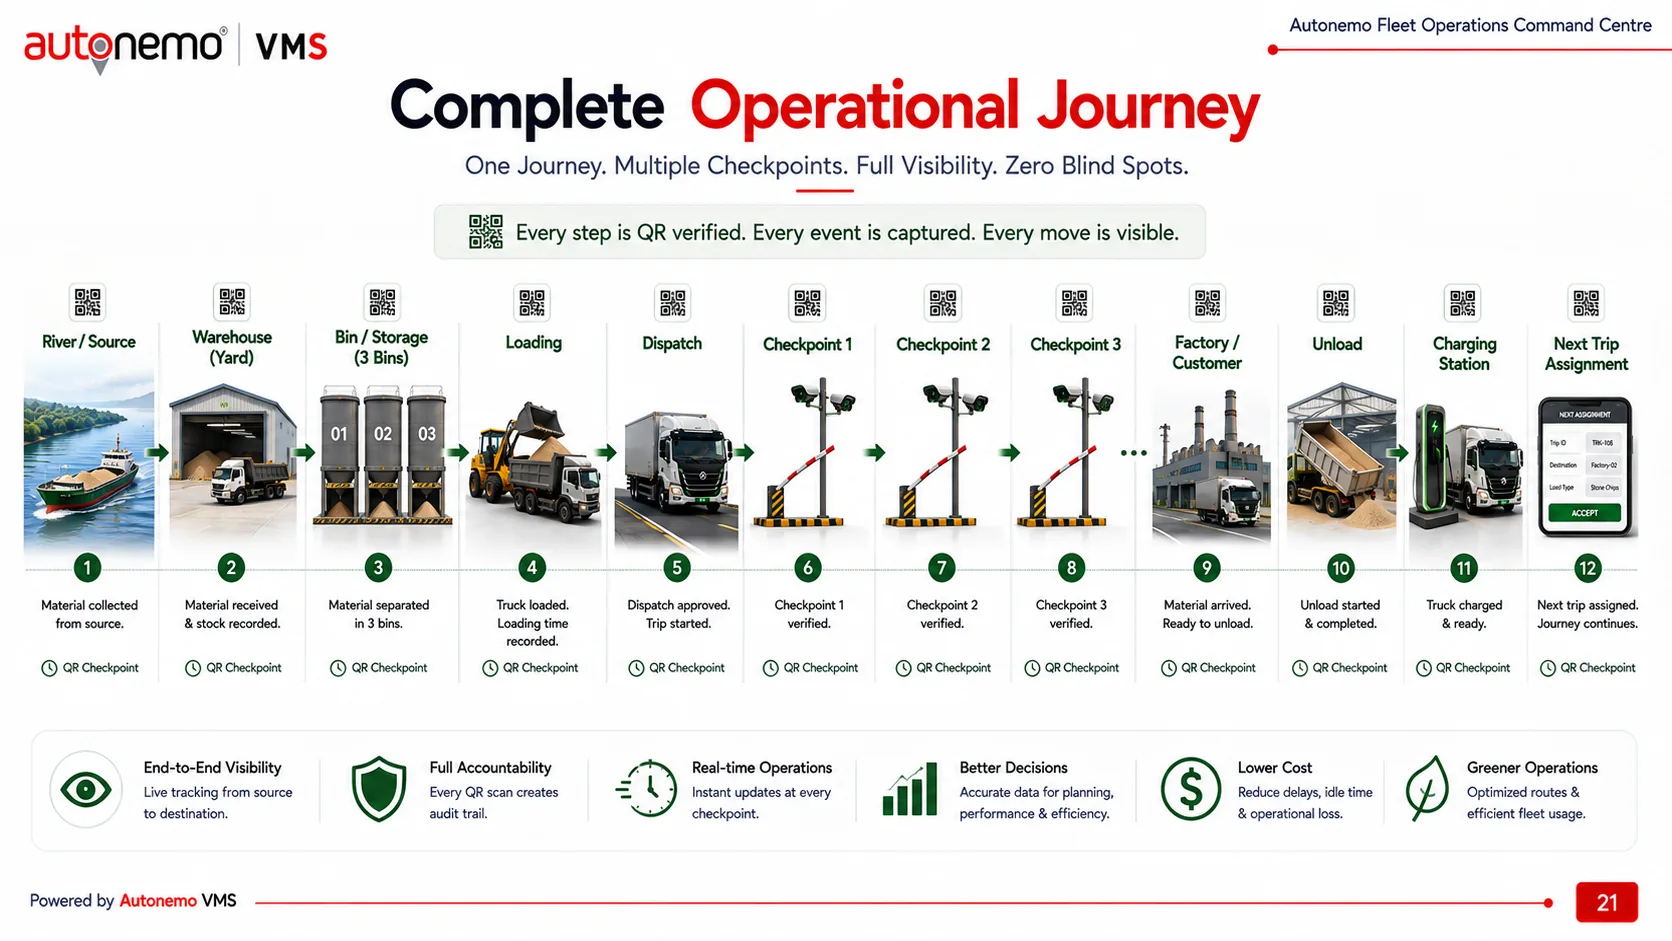
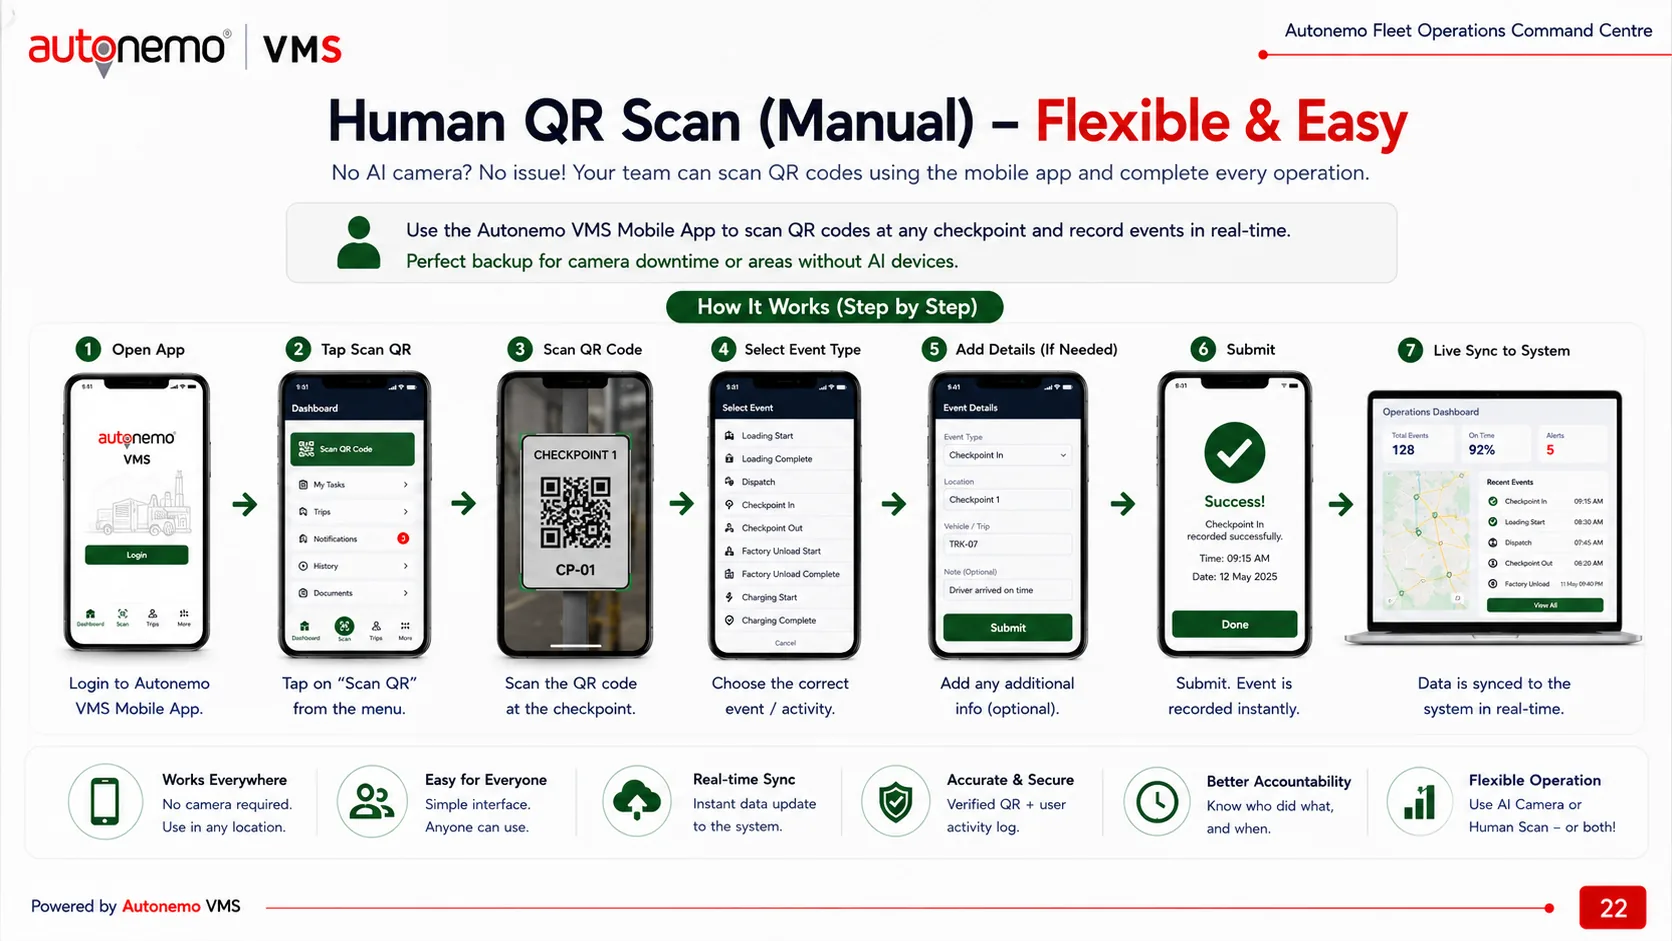
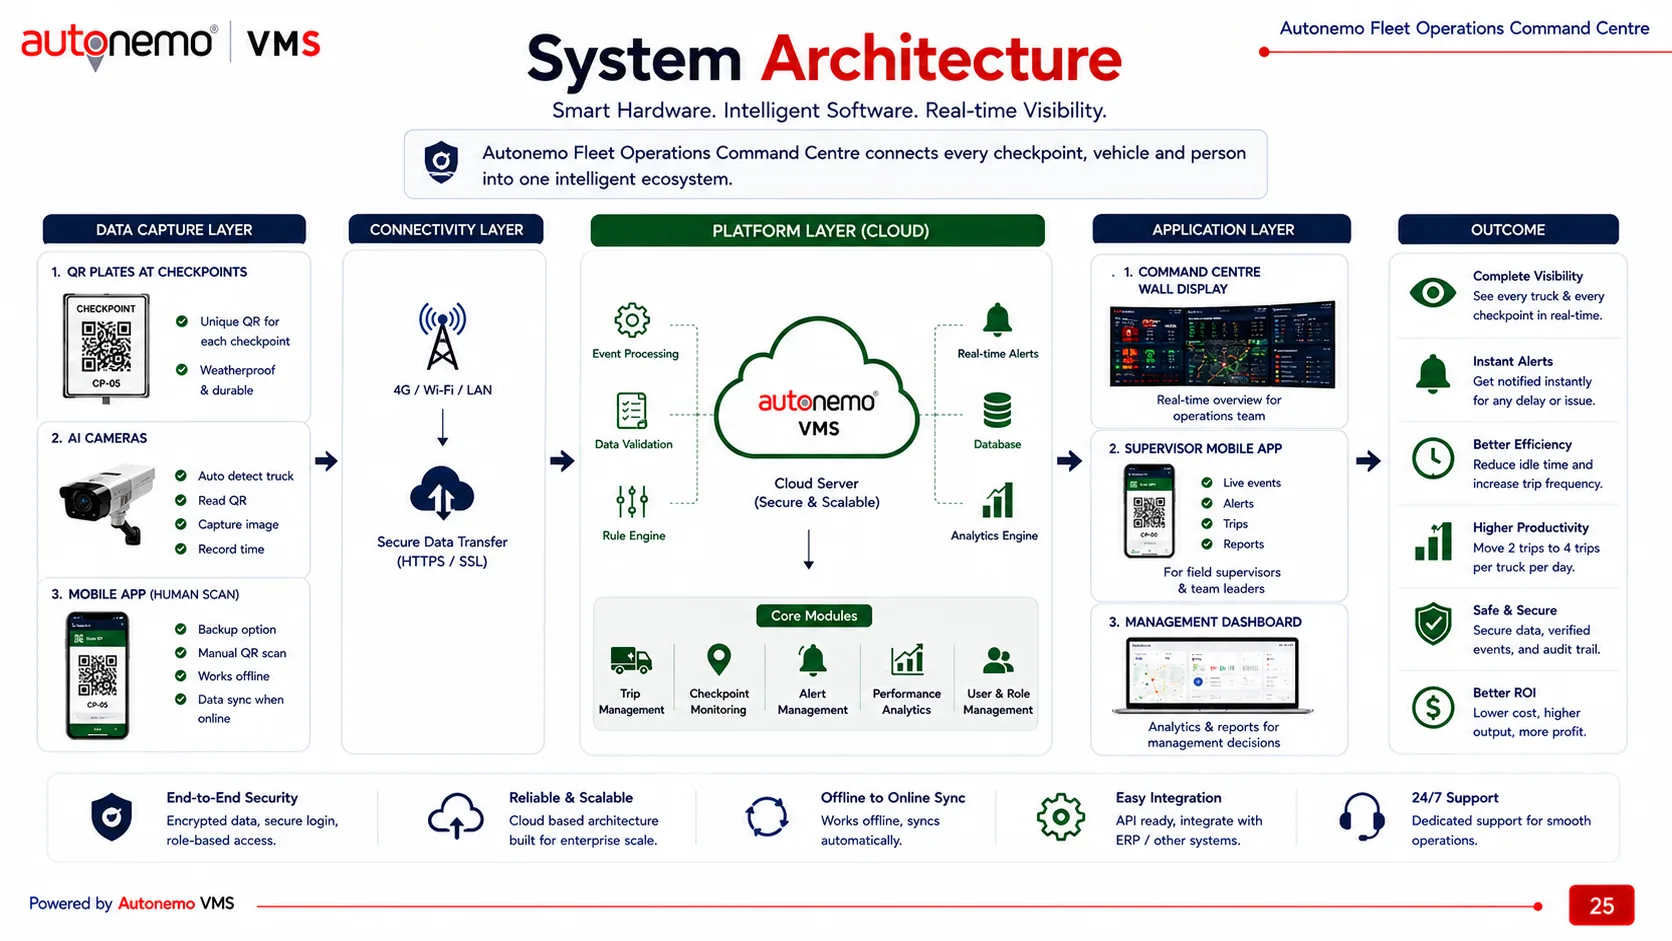
The command centre closes that gap by capturing the operation as it happens. Each stage of the journey — collection at source, warehouse receipt, bin separation, loading, dispatch, three road checkpoints, factory arrival, unload, charging, next assignment — carries a QR checkpoint. A scan writes a timestamped, verified event; the timeline builds itself. Where an AI camera reads the code automatically, nobody touches anything; where there is no camera, staff scan the same code from the mobile app and the event lands identically.
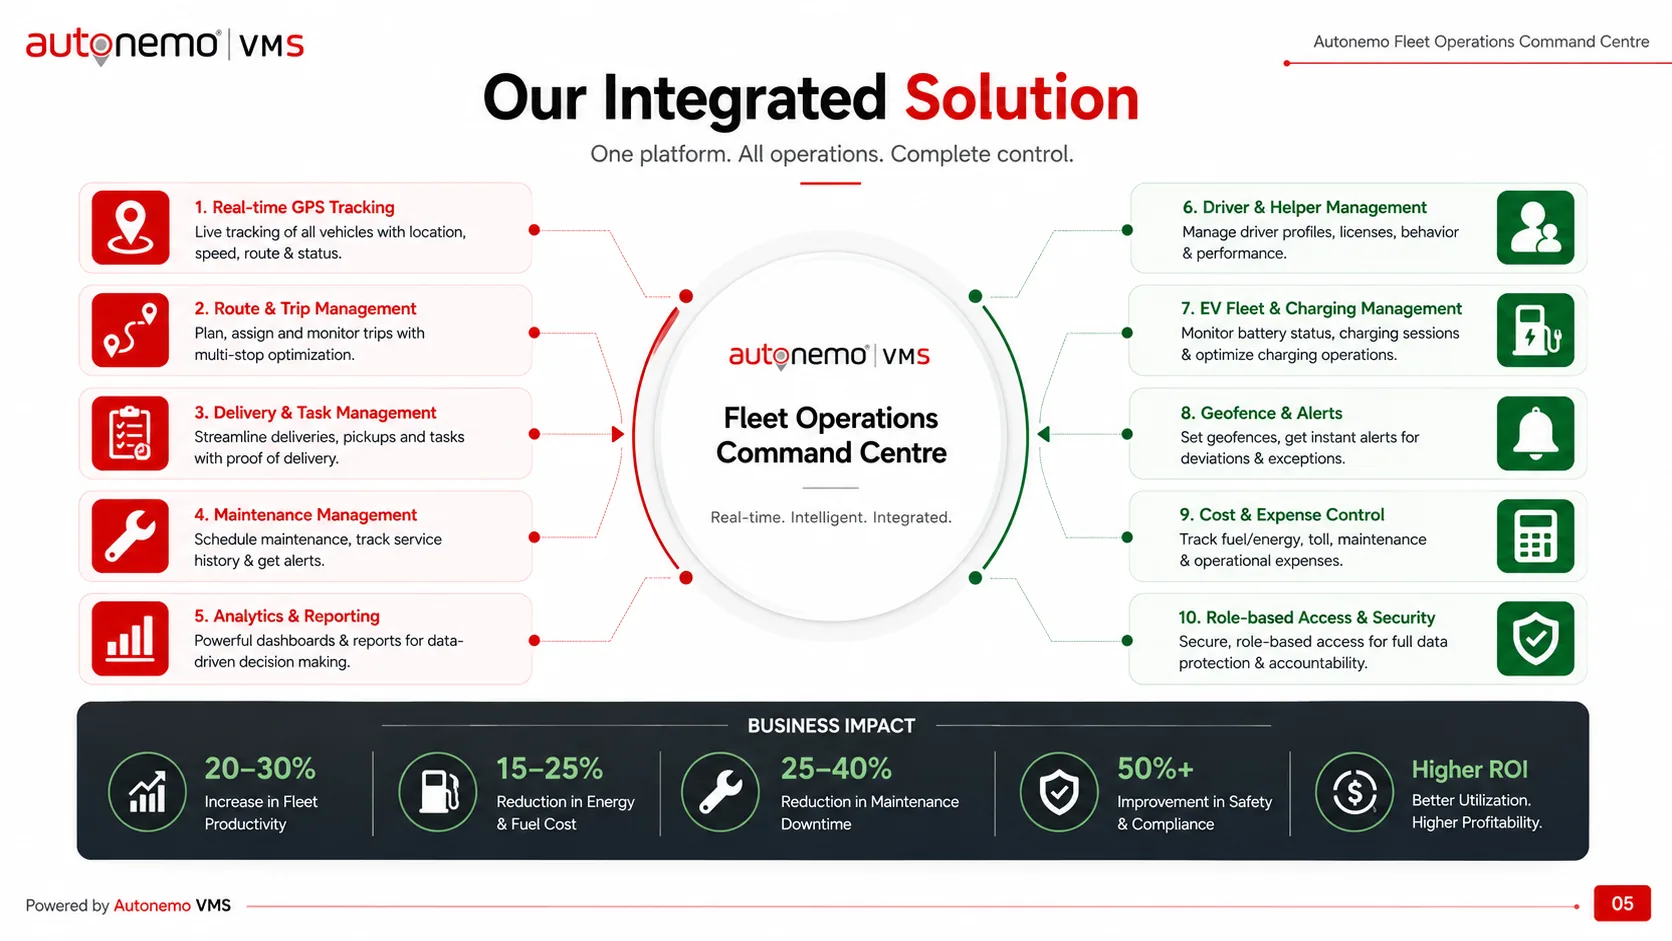
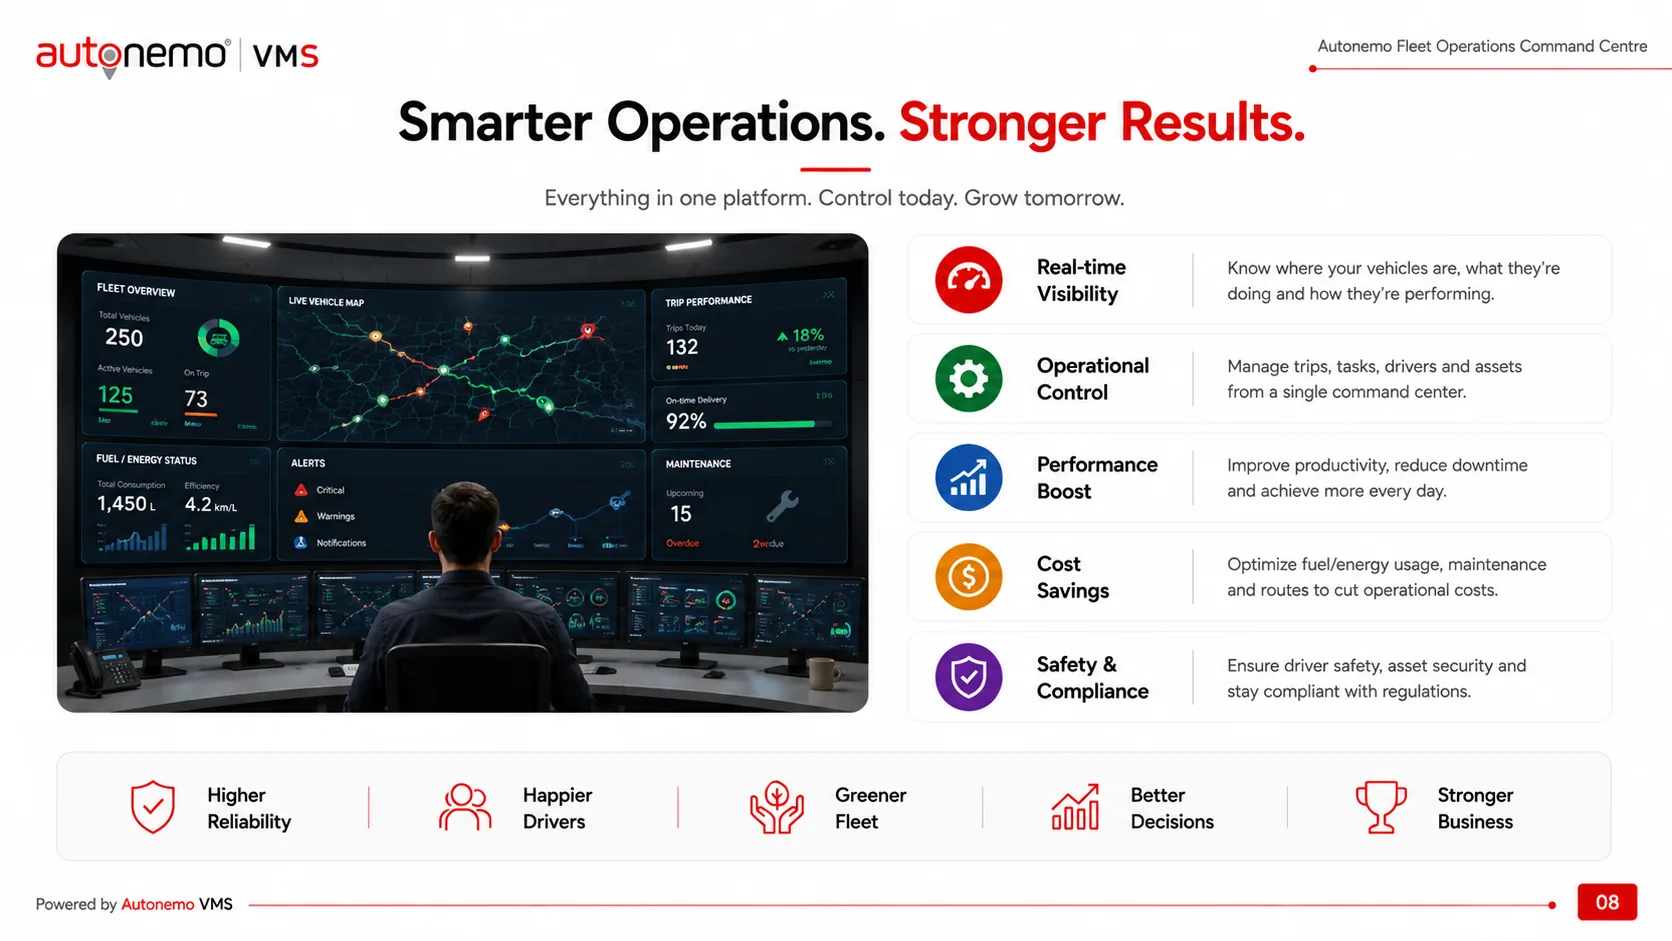
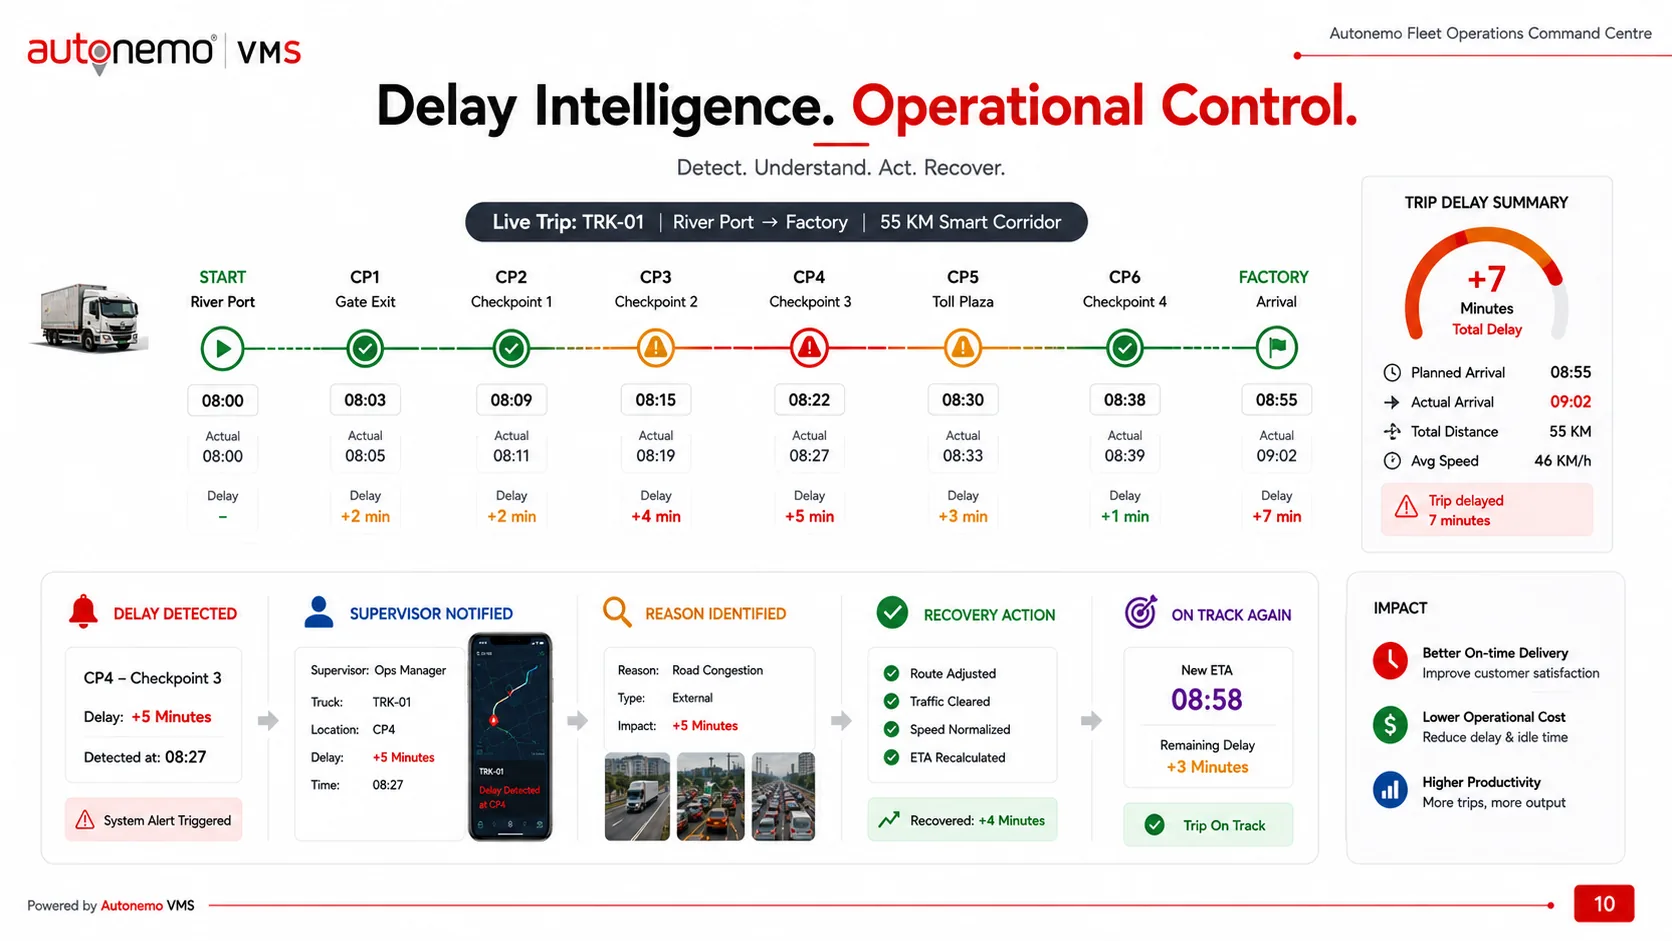
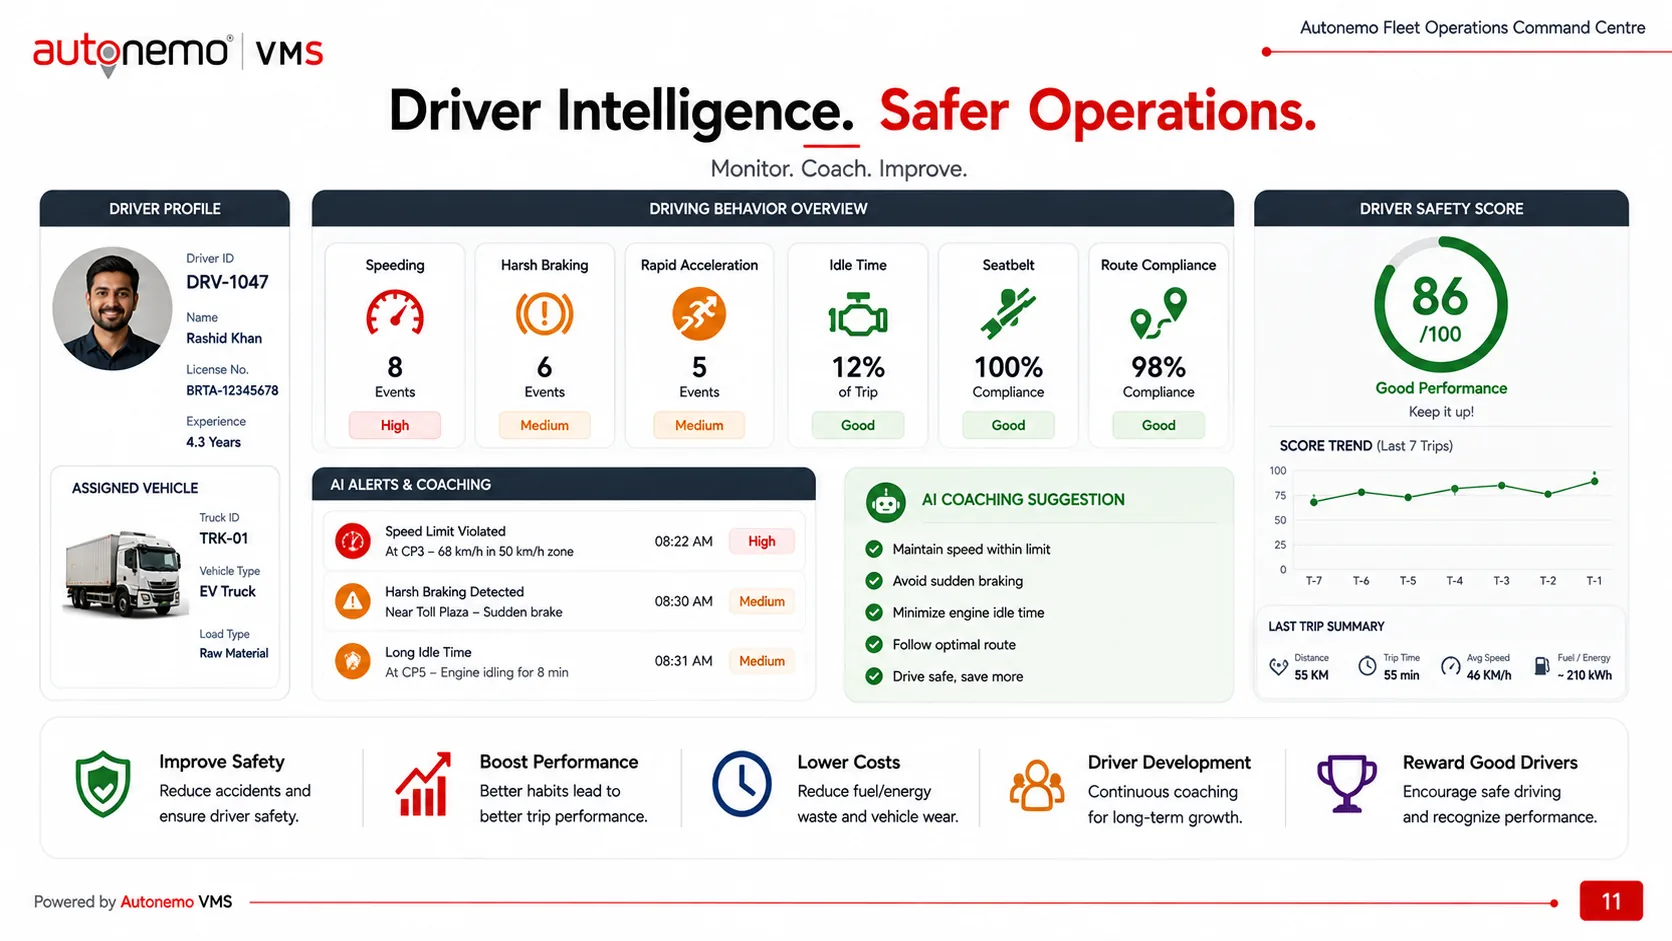
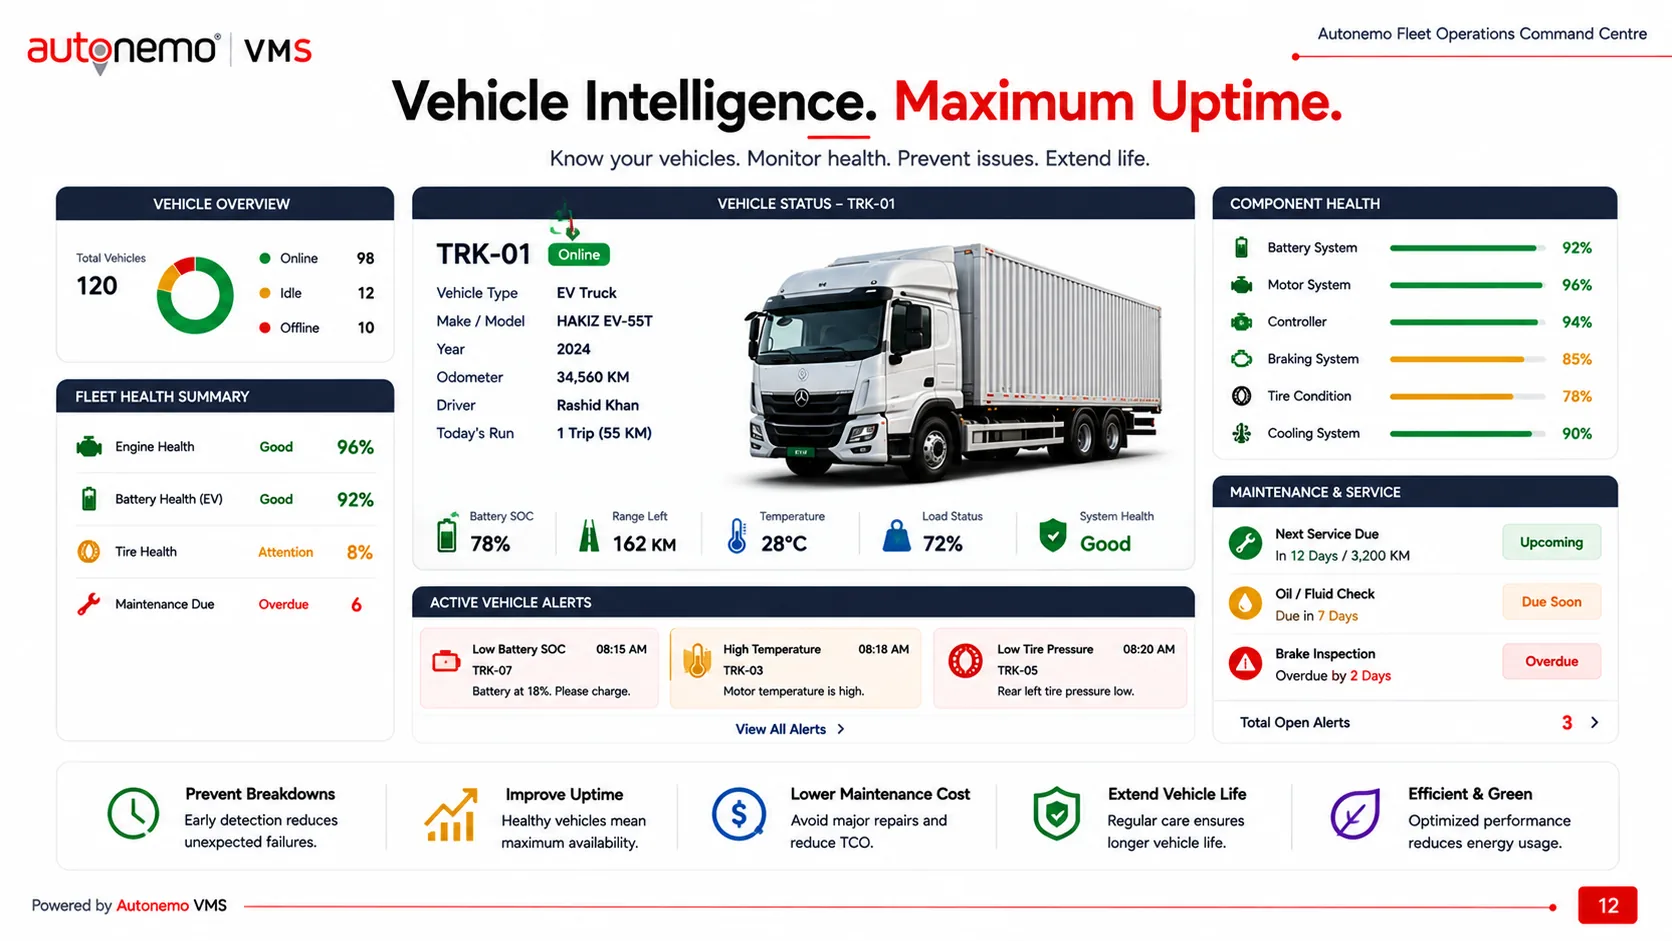
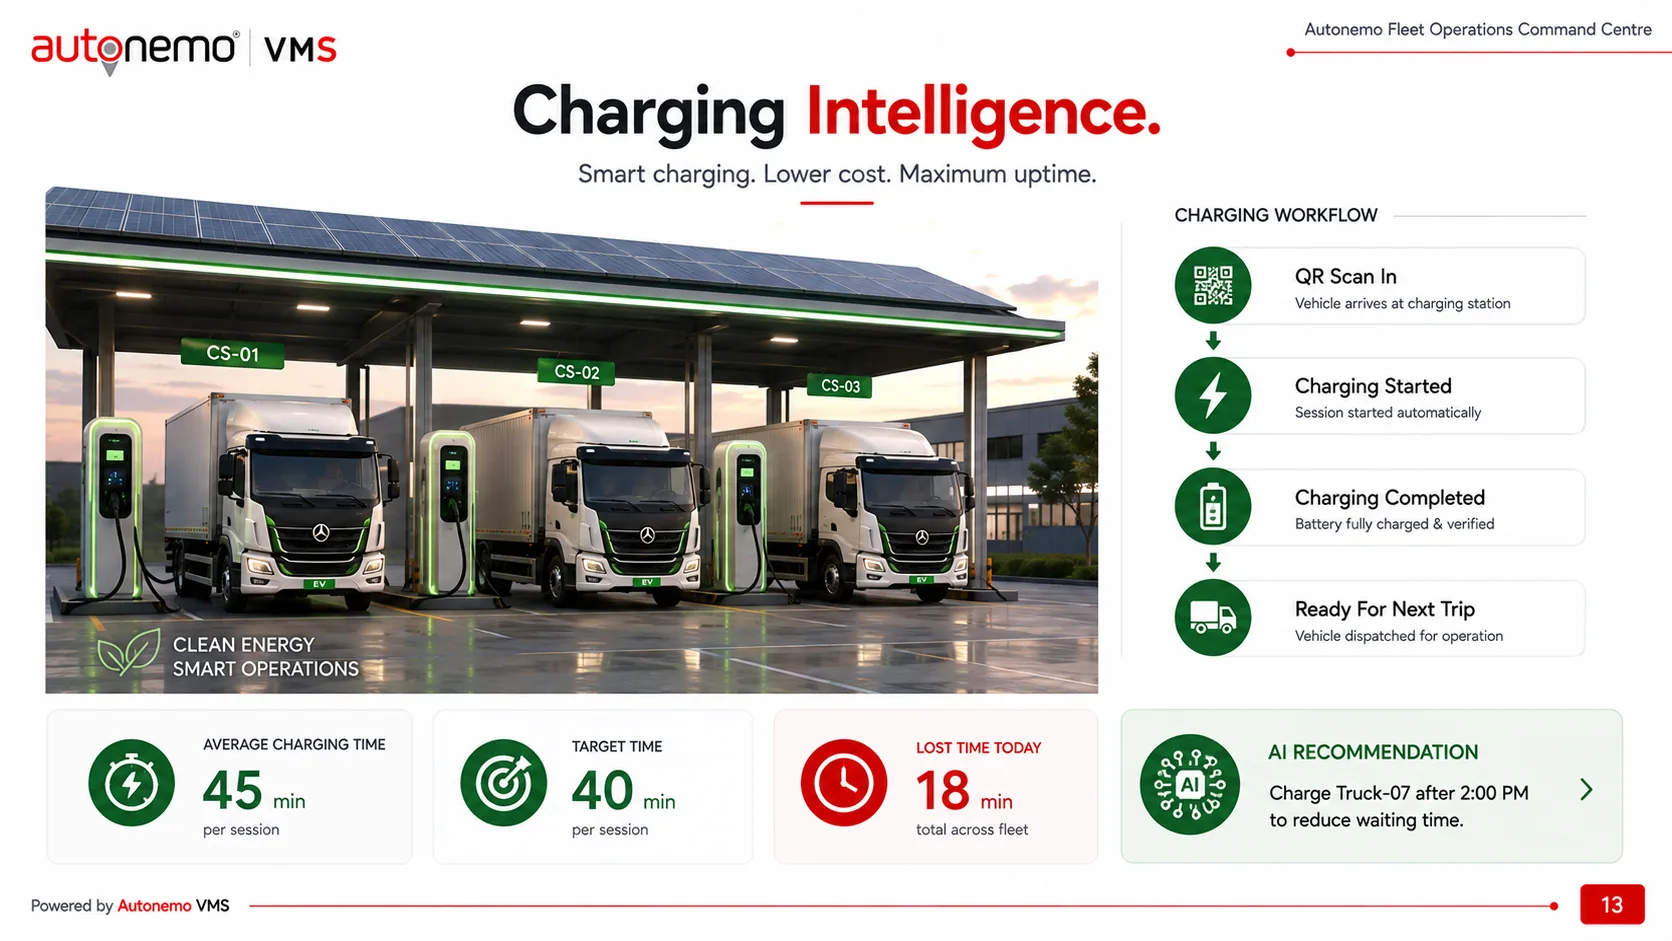
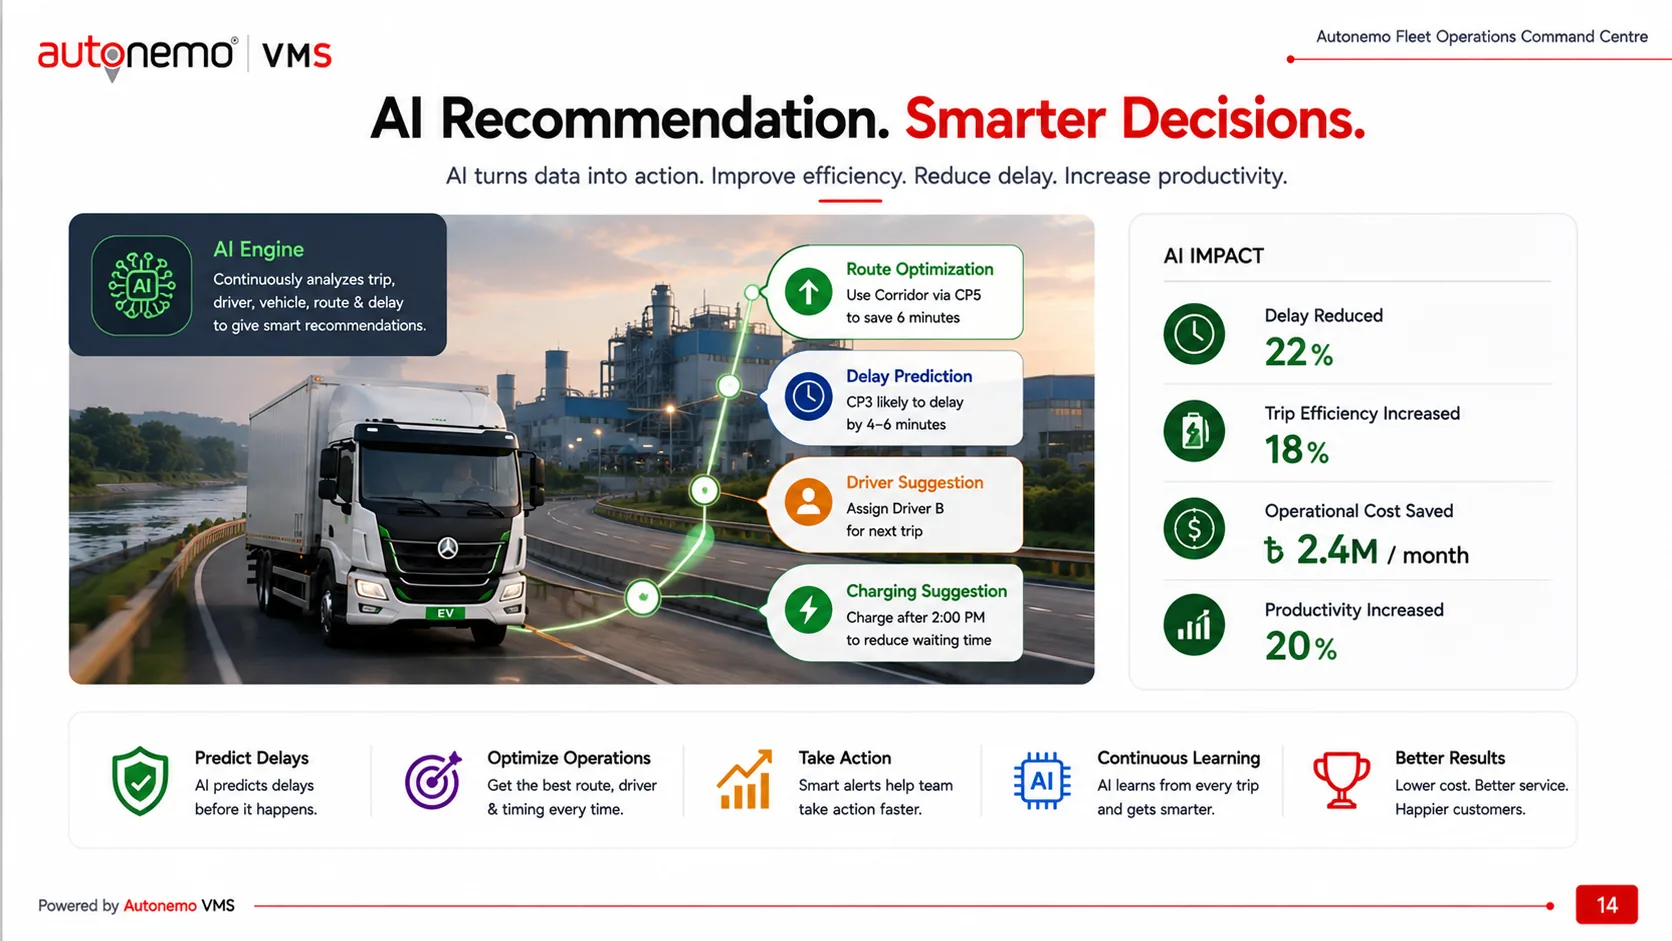
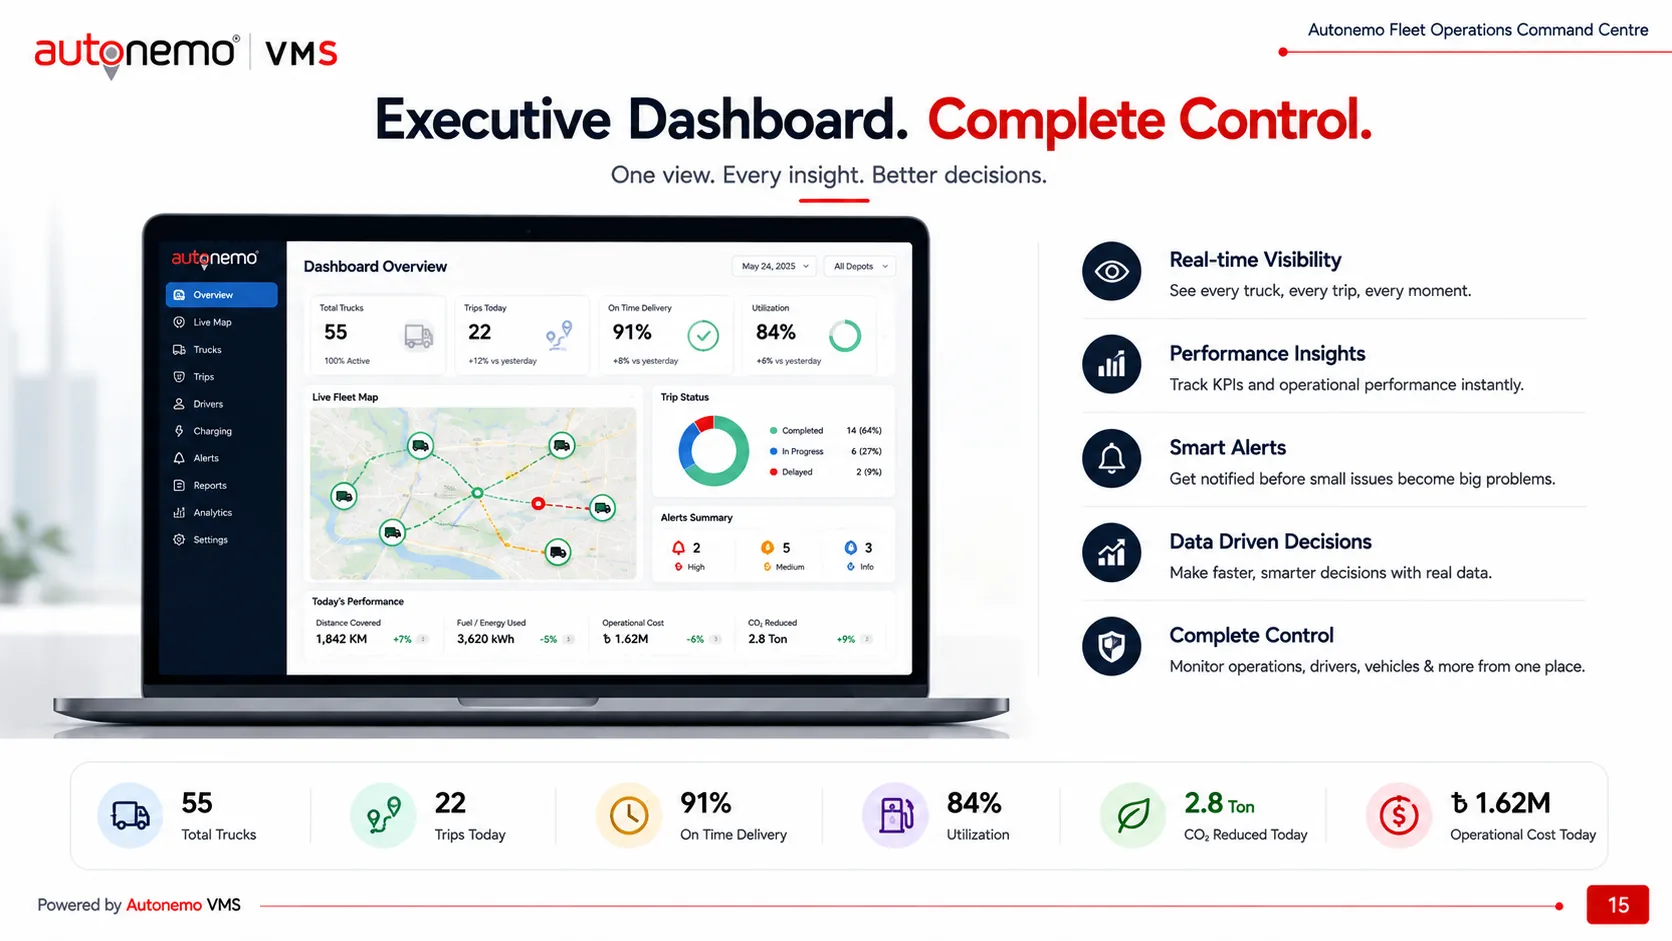
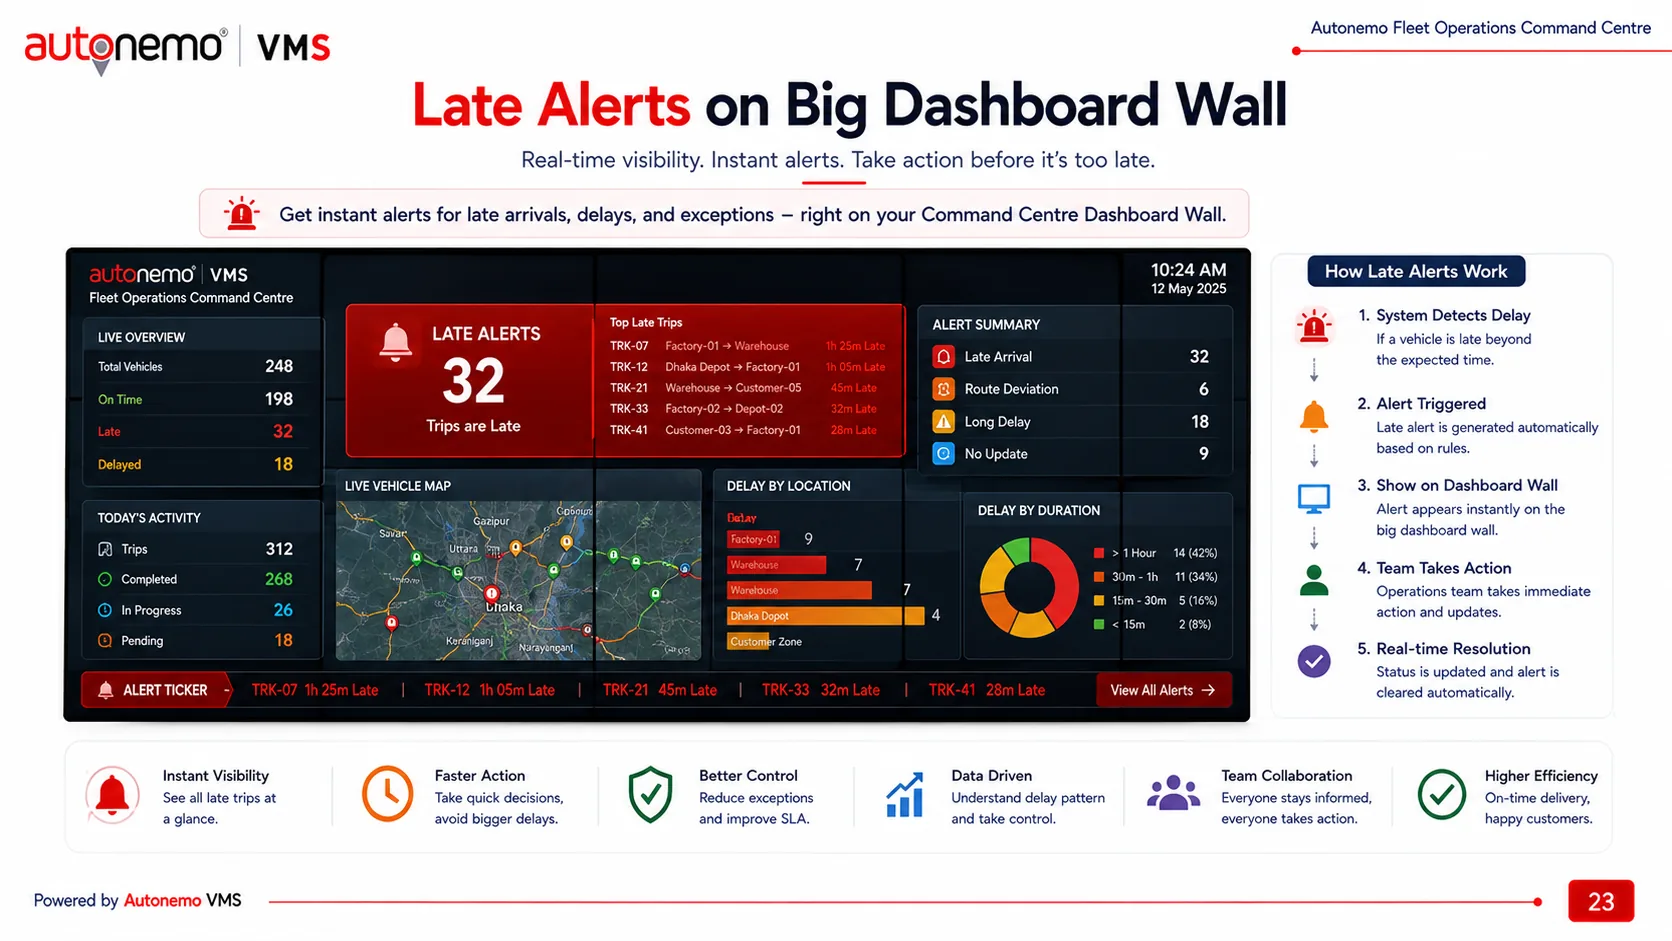
On top of that event stream sit the intelligence layers: delay intelligence that detects a slip, names its root cause and suggests the recovery; driver intelligence with behaviour and safety scoring; vehicle intelligence watching component health and uptime; charging intelligence that schedules sessions around cost and readiness; and AI recommendations that turn all of it into a next action. The executive dashboard wall puts live fleet status, on-time performance and late alerts in front of management while the day can still be changed.
All 29 slides, right here.
The complete proposal — swipe, use the arrows or jump to any slide. Nothing to download first.
← → to move F for fullscreen Swipe on touch 29 slides · 6.4 MB PDF
Nine layers of operational control.
Smart QR checkpoint automation
Ten checkpoints along the corridor. Every arrival, departure and handover is scanned into a timestamped, verified event — no logbook, no memory, no dispute.
Human QR scan fallback
Where an AI camera isn't installed or is down, staff scan the same code from the mobile app in seven steps. Same event, same timeline — coverage never breaks.
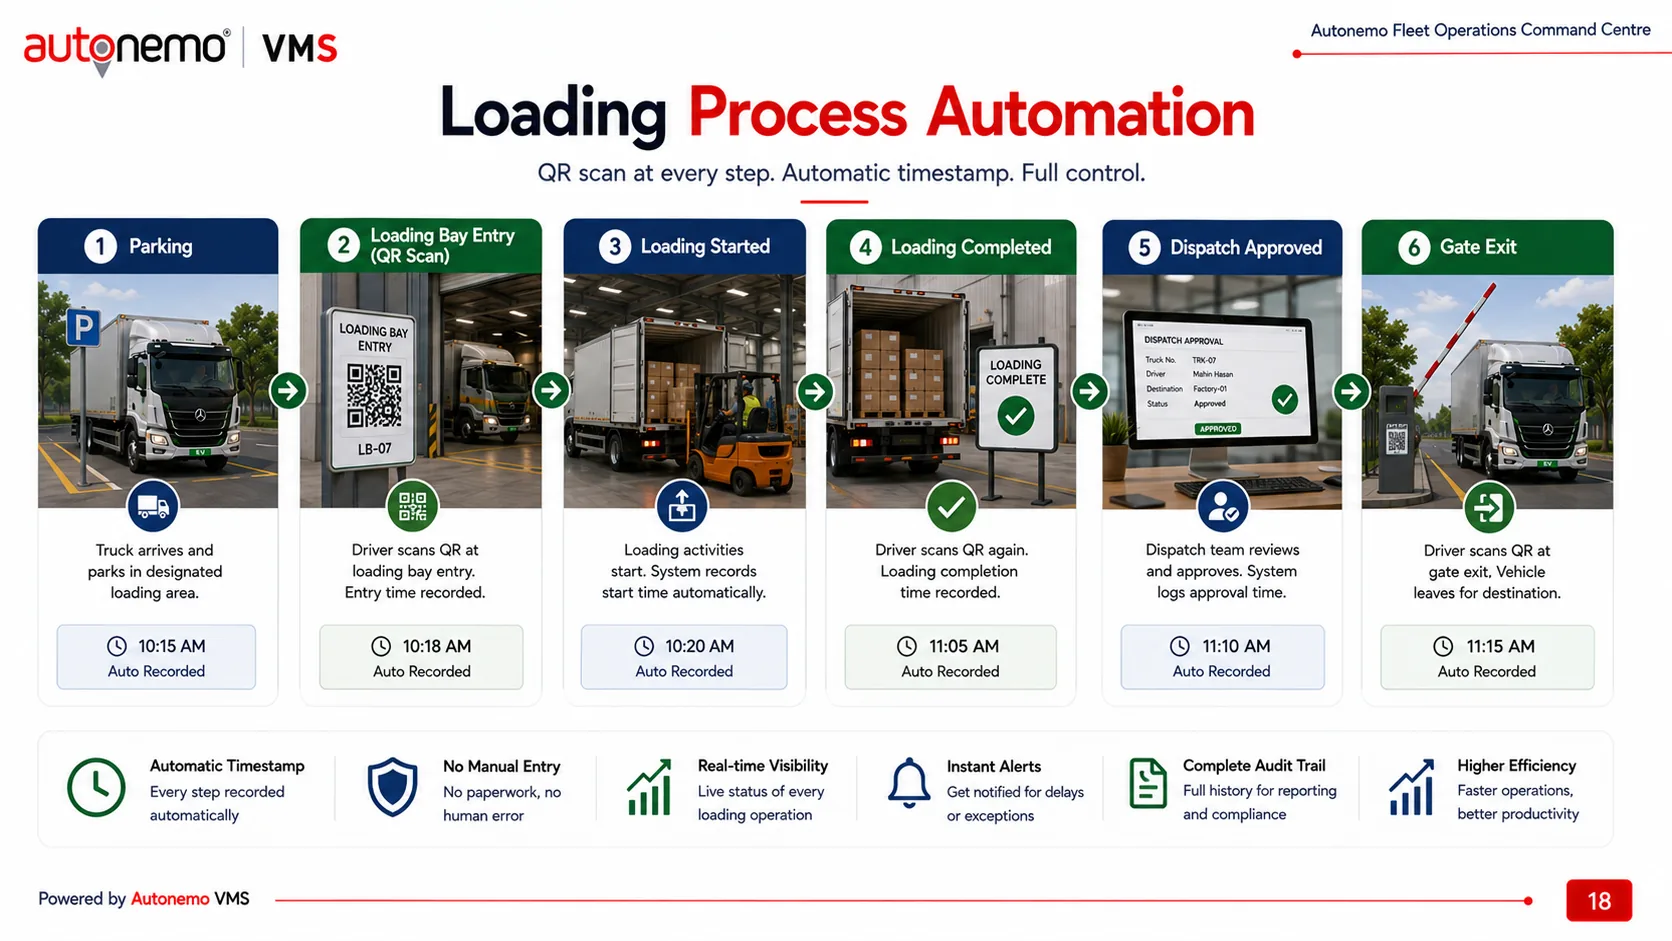
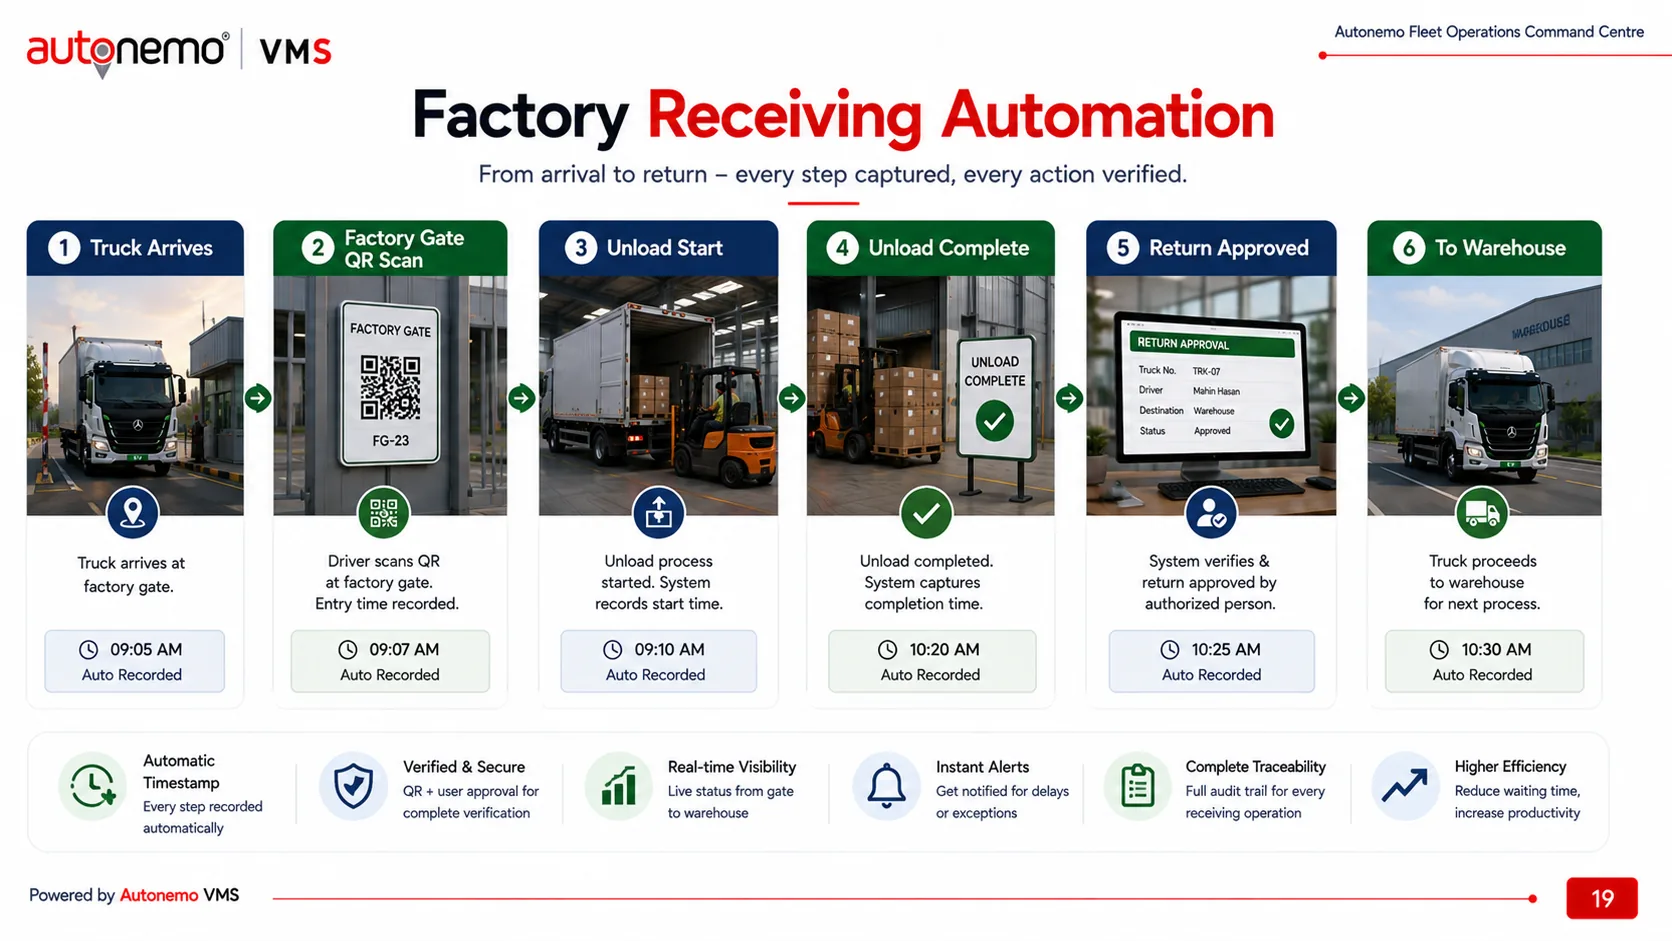
Loading & factory receiving
Bin separation, truck loading, dispatch approval, factory arrival and unload — each step captured with its own duration, so a slow bay shows up as a number.
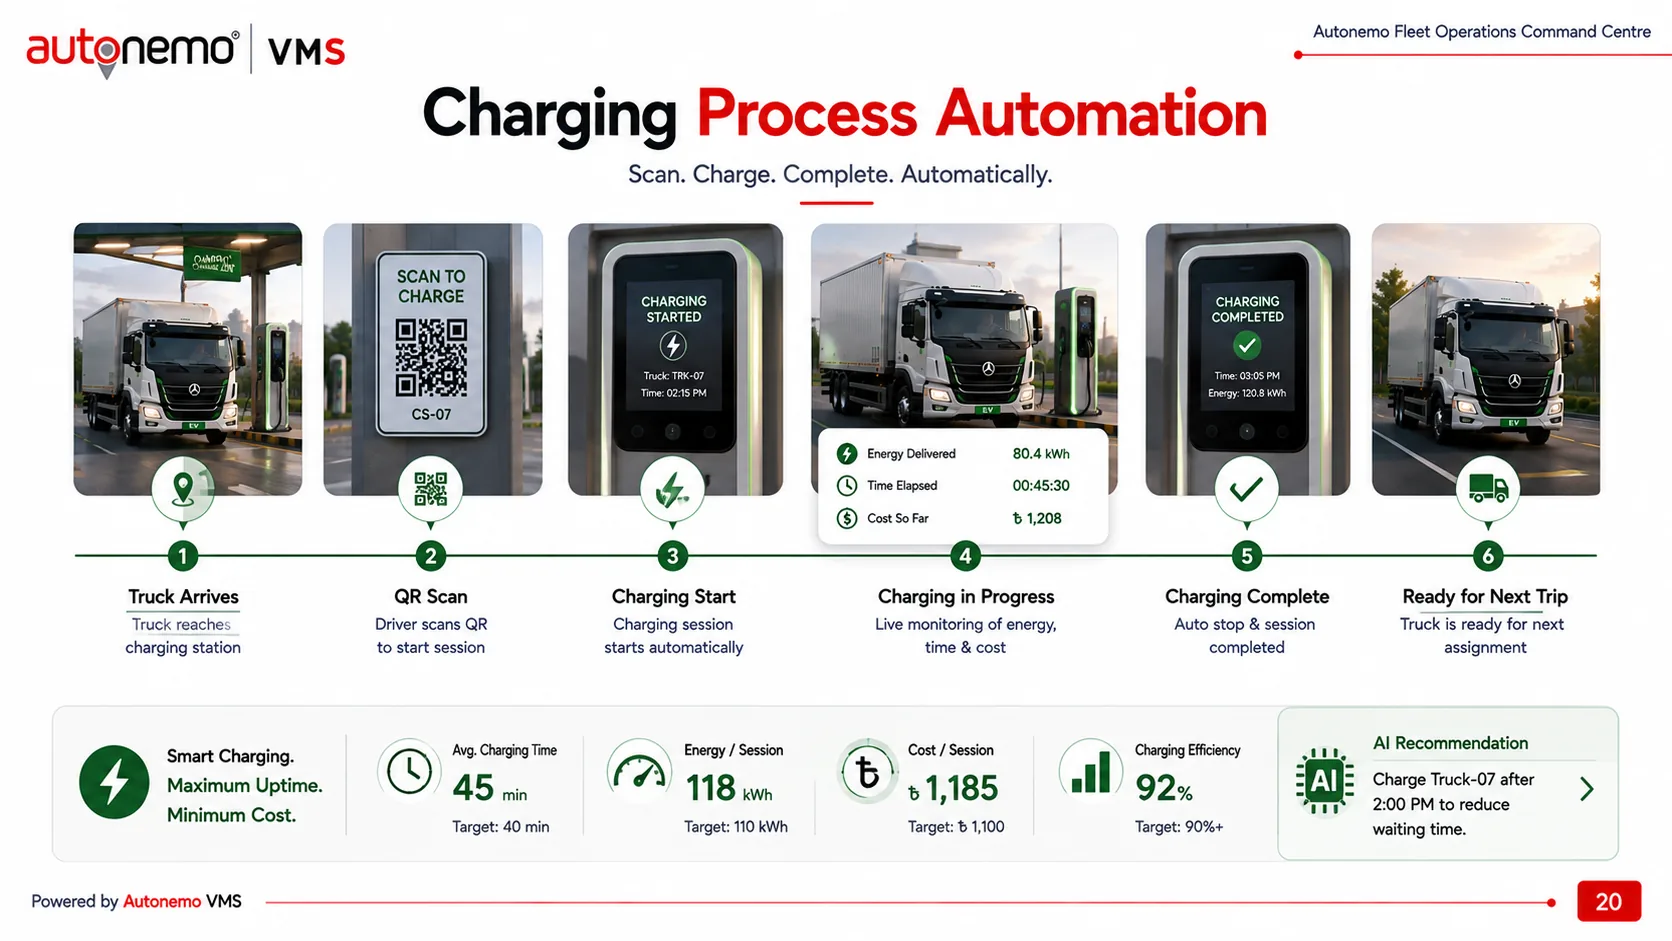
Charging automation
Scan to charge, live energy and cost monitoring, automatic session stop, ready-for-next-trip status — with an AI hint on when to charge to avoid the queue.
Delay intelligence
Detect the slip, identify the root cause, suggest the action, track the recovery. Delays stop being an end-of-day explanation and become a live exception.
Driver intelligence
Driver profile, behaviour breakdown and a safety score — the basis for coaching rather than blame, and for knowing who is actually carrying the operation.
Vehicle intelligence
Per-vehicle status, component health and battery condition, so maintenance is scheduled before a truck strands a trip instead of after.
Executive dashboard wall
Live fleet status, today's trips, on-time performance and active alerts on one big screen — management sees the day while it can still be changed.
ROI model & roadmap
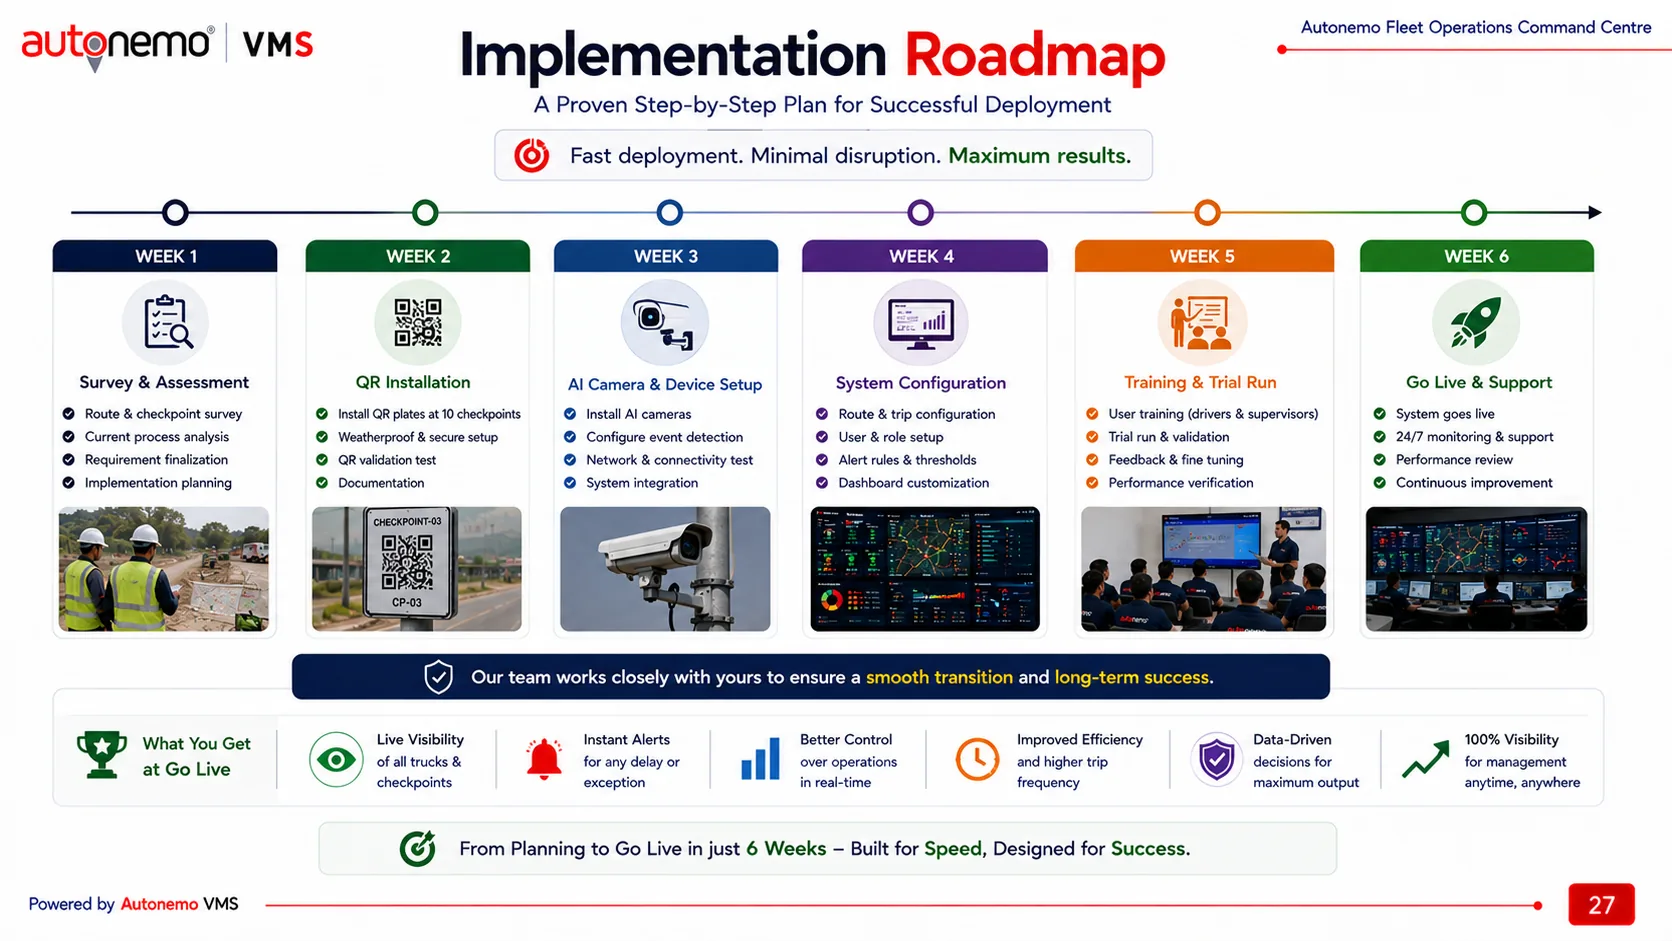
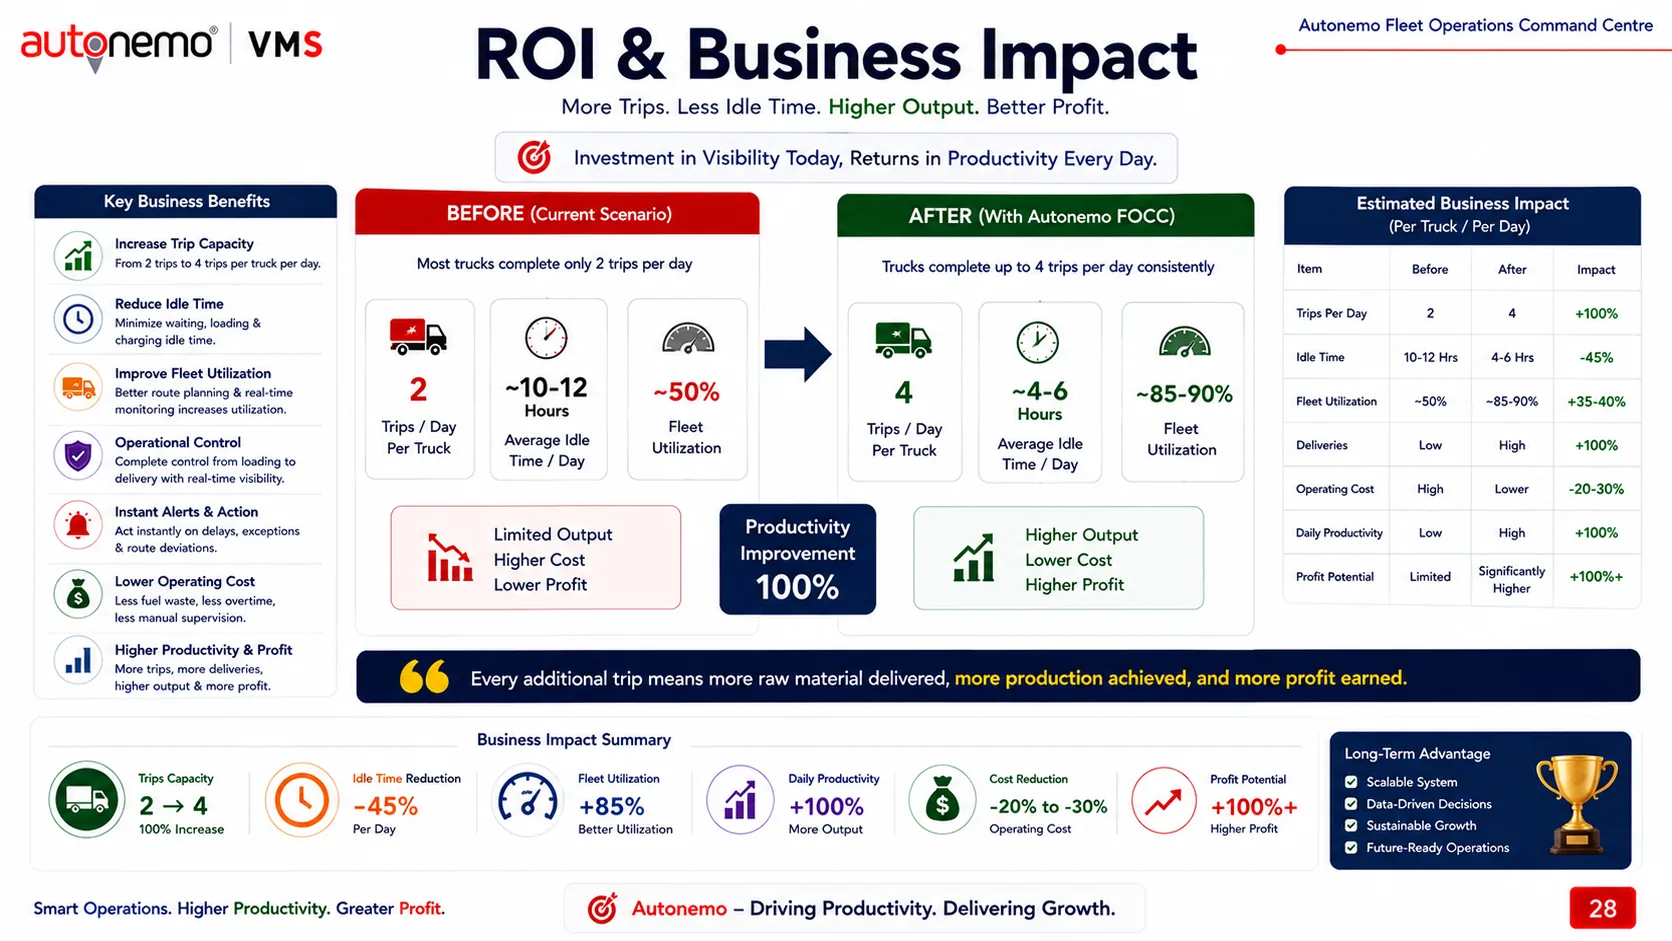
Trips, idle hours, utilisation, operating cost and profit modelled before and after — followed by a phased deployment plan with minimal disruption.
Same trucks. Twice the work.
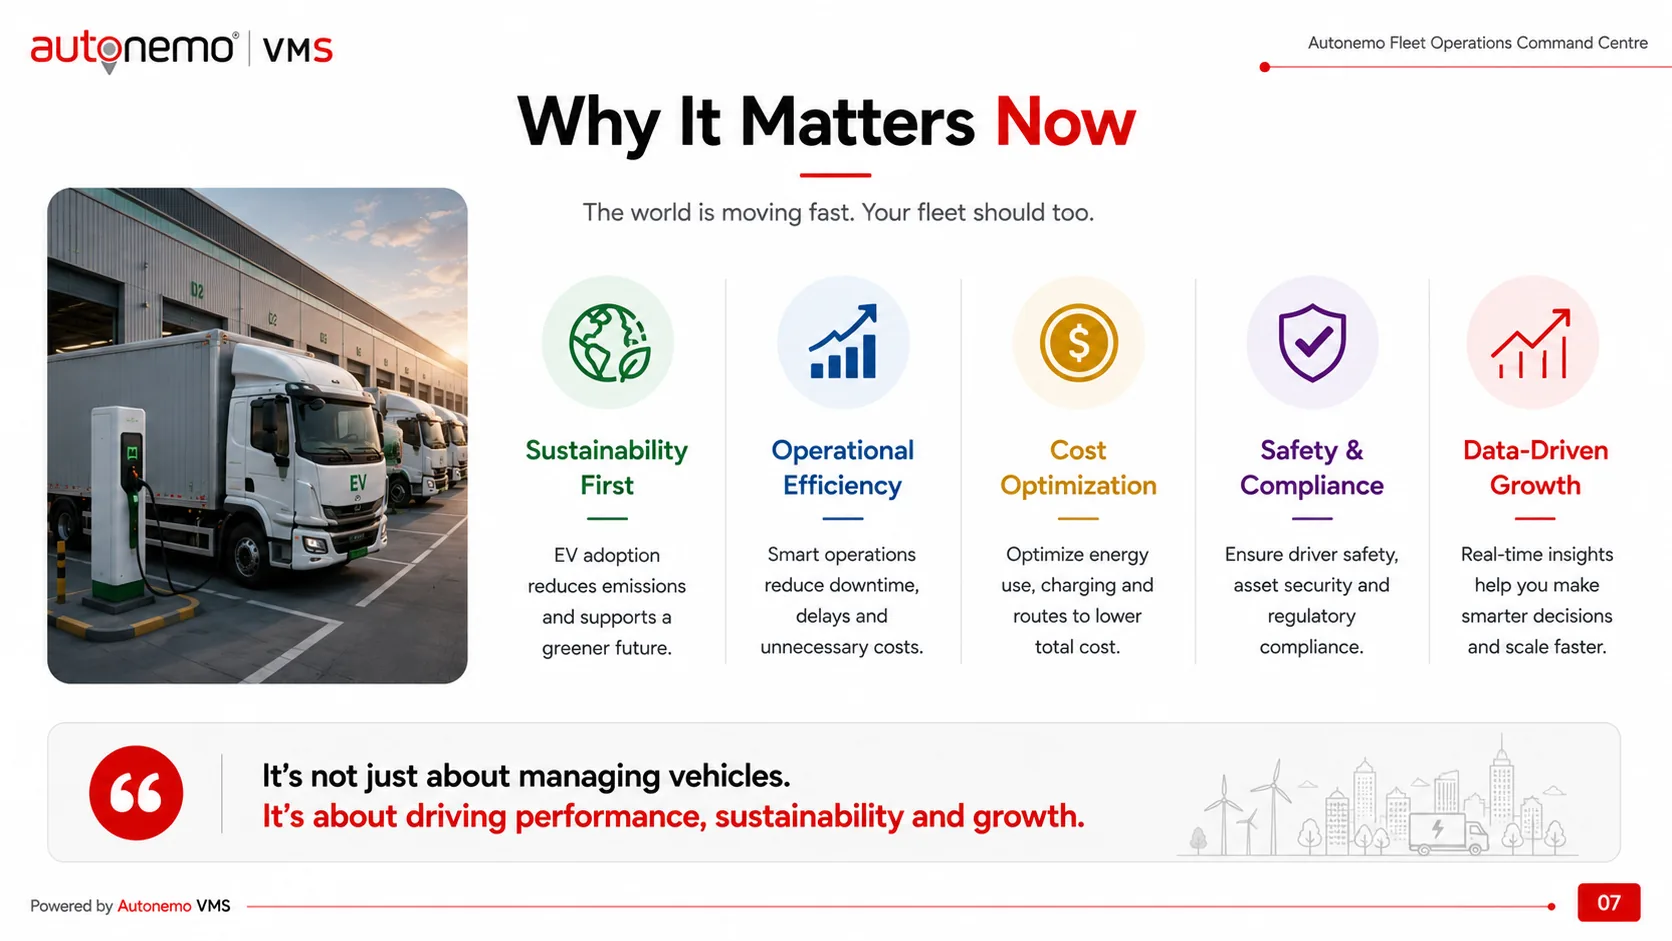
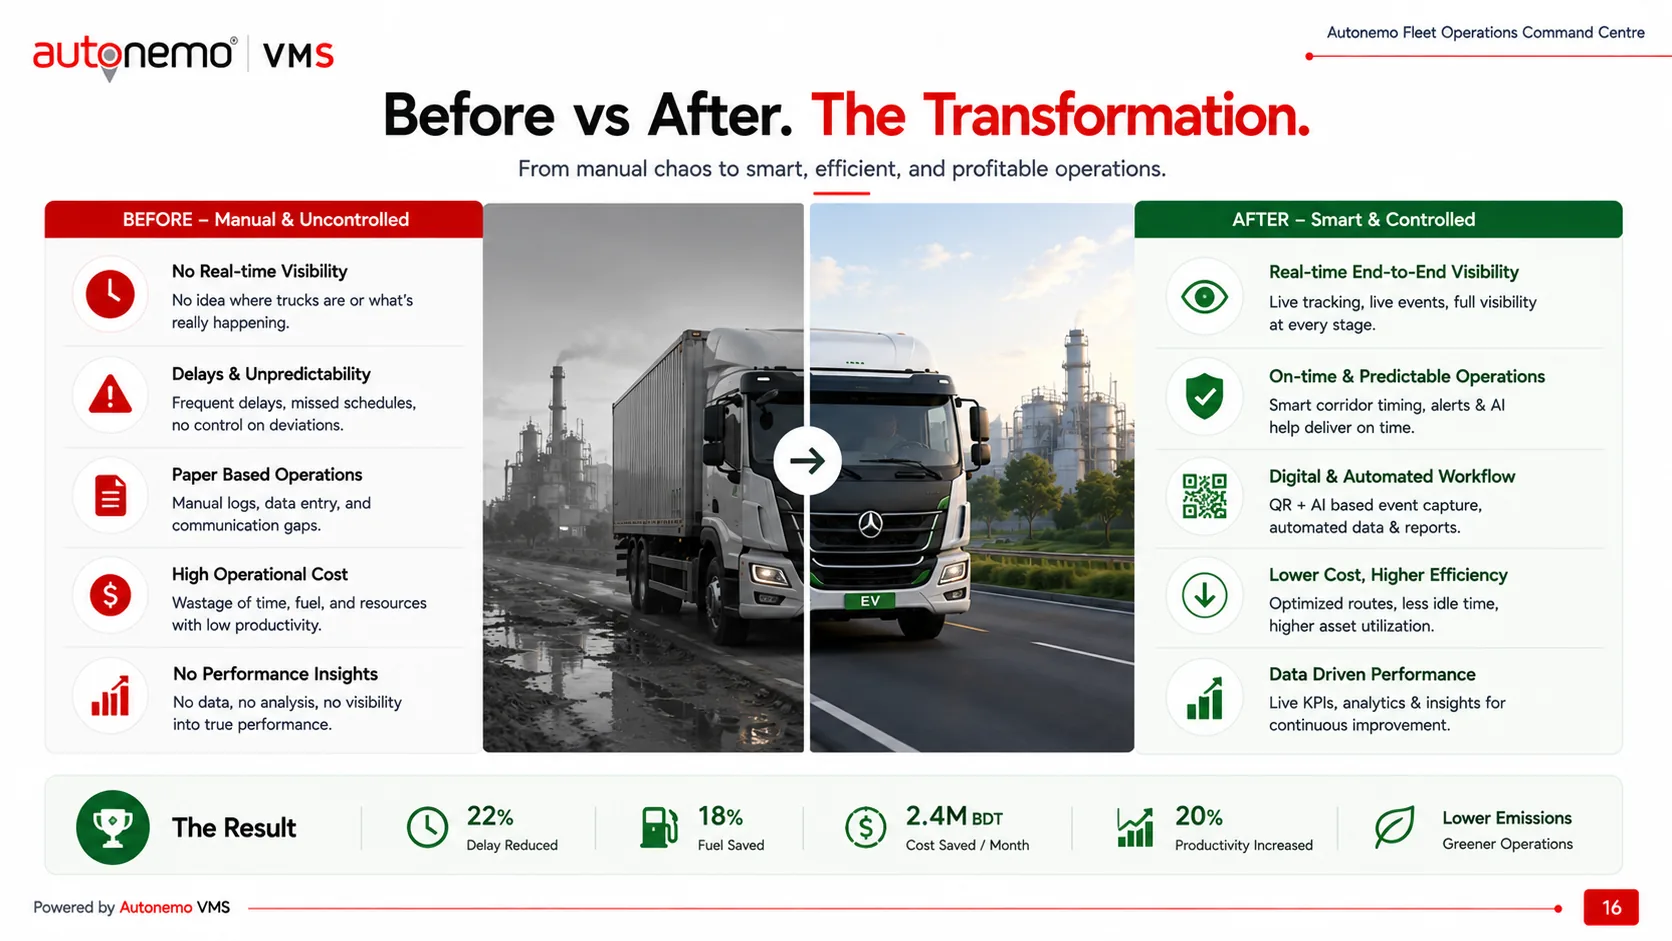
The deck's closing argument is deliberately unglamorous: no new vehicles, no new drivers, no new route. Just the hours that were already being lost, given back. Idle time per truck falls from ten to twelve hours a day to four to six; fleet utilisation moves from around half to eighty-five or ninety percent; operating cost drops twenty to thirty percent; and daily productivity doubles as each truck completes four trips instead of two.
Every one of those numbers traces back to the same mechanism — an event that used to be invisible is now timestamped, attributed and alerted on. That is the whole thesis of the command centre.
Know where your hours go.
Talk to me about a command centre for your fleet — or about the Autonemo VMS platform it runs on.